Bitcoin, Ether, and XRP Weekly Market Update: January 31, 2019

The global market cap moved from $119 billion to $115 billion for the seven-day period as all top ten cryptocurrencies, with the exception of XRP, TRON and Litecoin, registered losses. At the time of press, bitcoin is trading at ~$3,479 and ether at ~$108.
BTC/USD
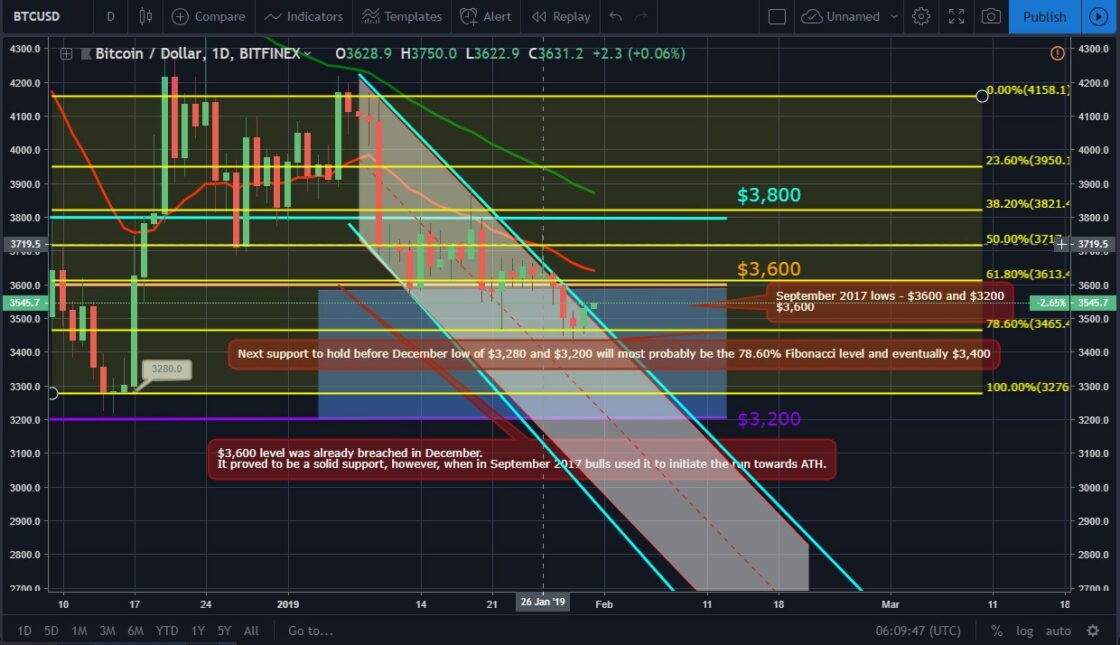
Bitcoin closed the trading session on January 25 at $3,625 as it could not keep the bullish momentum initiated on January 22.
Buyers tried to regain their territory once again and pushed BTC/USD price up to $3,745 during day trading on January 26 just to go back down to $3,630. On January 27, the most popular cryptocurrency dropped to $3,595 as all indicators were confirming the continuation of the bear trend. Bitcoin was down three percent for the seven-day period.
The multinational financial services giant Fidelity Investment is planning to launch its Bitcoin Custody Service in March 2019 as reported by Bloomberg. In October 2018, the company that manages $7.2 trillion in assets launched a new subsidiary called “Fidelity Digital Assets” with the idea to “ease fears of trading cryptocurrencies” among institutional investors and help them trade digital assets. The custody service represents a financial practice wherein a third-party holds assets to reduce the risk they’ll be lost or stolen, which is something the space sees on a daily basis.
U.S.-based crypto exchange Coinbase added new resources for crypto taxes for citizens of the United States. According to the January 25 blog post, the company is now offering a general education guide on crypto and taxes for the past year. These resources include Crypto and Bitcoin Taxes in the US, 2018 Edition, and Tax Resource Center to its customers. The exchange has also partnered with TurboTax for easier tax calculation through their TurboTax Premium product and also with CoinTracker to follow transaction activity for 2018.
During the last seven days, BTCManager managed to cover a number of stories from the crypto industry including the new Italian blockchain regulation paper, the sentence issued for the BitGrail exchange owner and the arrest of a Bulgarian crypto exchange owner. Coverage also included the British FCA’s “Guidance on Cryptoassets” paper and the upcoming Saudi Emirati cross-border digital currency.
The joint Saudi Arabia and UAE cryptocurrency will be called “Aber” as clarified by The Saudi Arabian Monetary Authority (SAMA) and The United Arab Emirates Central Bank (UAECB) in a press release. The coin will be limited to financial settlements using distributed ledger technologies (DLT) and for exclusive use by a limited number of banks in the two countries.
Staying in the Middle East, Iran is looking to launch a state-backed cryptocurrency. With U.S. economic and financial sanctions still in play, the country is in a desperate need of a workaround after local banks were banned from accessing the cross-border payments system SWIFT. According to the regional media Al Jazeera the virtual currency will most probably be announced after the annual two-day Electronic Banking and Payment Systems conference, which kicked off on January 29 in the capital city, Tehran. Additionally, the country is reportedly negotiating the use of cryptocurrency in its financial transactions with eight countries, as reported by local media.
Bitcoin lost 2.7 percent on January 28 as it extended losses to $3,500, now clearly in the downtrend channel, after breaking below the 61.80 percent Fibonacci level. On January 29 the BTC/USD pair dropped even further touching $3,420 during day trading just to close the session at $3,470. On the next day, January 30, it rebounded from the 78.60 percent Fibonacci level and formed a green candle on the daily chart to $3,530.
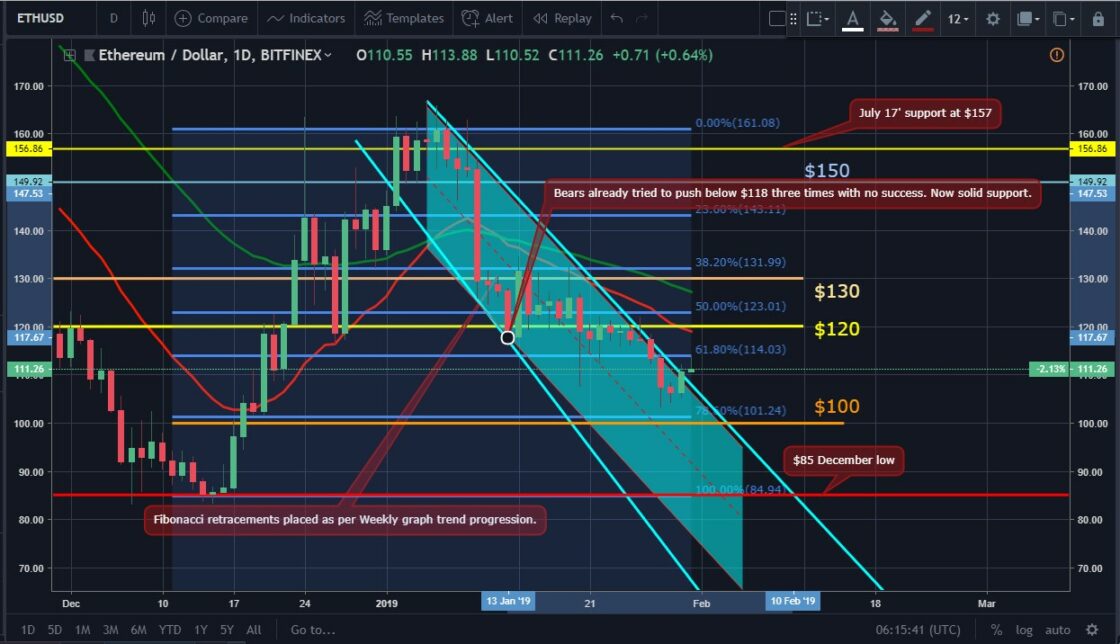
ETH/USD
Ether hasn’t seen a green candle on the daily chart since January 24 as it continues its decline. It dropped from $119 to $117 on January 25, but the strong support at $117 to $118 was not easy to break and bulls managed to push the price back up to $122 on January 26.
The run was short-lived, however, and the coin closed the session with no change compared to the previous day. The immense pressure from sellers finally gave result and the ETH/USD pair declined to $133 on January 27 right below the 61.80 percent Fibonacci level. The pair lost about eight percent over the seven-day period and another five percent on January 28 when it reached $107.
Ether continued its free fall losing approximately five percent on January 28 when it reached $107. One of the leading altcoins dropped below $110 for the first time since December 20, 2018, and eyed critical levels at $101 to $100. On January 29, ether posted another red candle on the daily chart, but managed to limit the losses to just $1, stopping at $106.
On January 30, BTCManager looked at the new blockchain-based SHINE Index by New America, ConsenSys, and Harvard T.H. Chan School of Public Health and tried to analyze current ETH movements. On the same day, it managed to jump back from $106 to $110 escaping the current downtrend channel.
XRP/USD
The January 28 XRP report covered the most important news in regards to the Ripple Company and XRP token including the Ripple Q4 2018 XRP Markets Report and the company’s new research scholarship program.
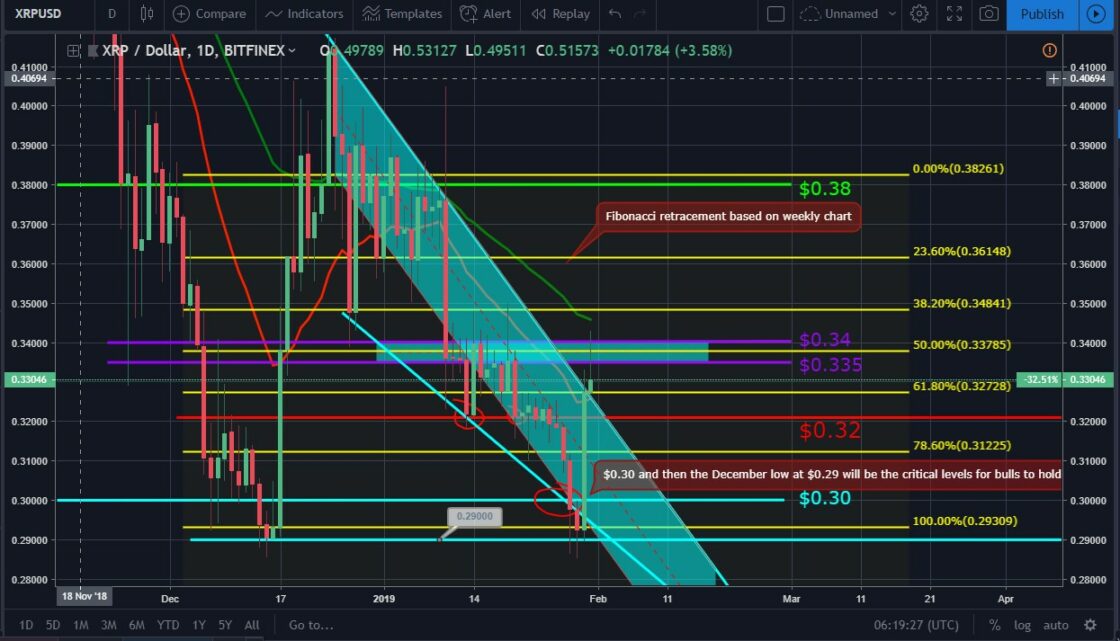
The Ripple company token closed January 25 at $0.319, right below the $0.32 support level. The XRP/USD pair was trading in the $0.314 to $0.324 range during the day, but a series of bad news had their impact on the performance of the coin.
The XRP dropped even further on January 26 and stopped at $0.318 in its second consecutive red candle on the daily chart. It fell with another 2.7 percent to $0.3099 on January 27 and moved below the 78.60 percent Fibonacci level closing the week 3.6 percent down. The Ripple token is now eyeing the psychological level at $0.30.
On January 28 XRP/USD lost another four percent of its value and moved south to $0.297. It was followed by another red candle on the daily chart on January 29 when the pair declined to $0.292, even closer to the December low of $0.29. On the next day, January 30, it bounced back up from the mentioned level with a stunning 10.5 percent price increase to close the session at $0.328.