


Bitcoin price faces $60K test as U.S.-Iran conflict escalates


Bitcoin traded under pressure as renewed U.S.-Iran strikes pushed traders toward the dollar and oil.
- Bitcoin held near $62,800 as U.S.-Iran strikes lifted oil, dollar, and pressure across crypto markets.
- ETF inflows supported Bitcoin, but MACD, RSI, and resistance still showed limited bullish confirmation overall.
- K33 said underwater Bitcoin supply suggests late-cycle stress, though another deeper downside move remains possible.
According to the crypto.news market data, the asset traded at around $62,920. The token stayed close to the $62,000 area after falling about 1% during Asian trading, with Ether, XRP, and Solana also weaker.
The move came as the U.S. and Iran exchanged fresh strikes, according to Reuters. Oil rose as traders priced in renewed risk around the Strait of Hormuz, while the Dollar Index held near 101. A stronger dollar and higher oil prices can reduce demand for crypto because traders often cut risk when energy costs and rate fears rise.
The latest pressure reverses part of Bitcoin’s earlier recovery. The token climbed above $65,500 after a U.S.-Iran peace deal eased oil fears and helped risk markets recover. The new strikes put that calm back under review.
The broader market reaction shows BTC still trades like a risk asset during fast macro shocks. Traders moved toward dollars and oil-linked hedges, while crypto assets gave back part of their recent rebound.
Bitcoin ETF inflows offer limited support
Spot Bitcoin ETFs gave the market some support, but not enough to push BTC through resistance. SoSoValue data showed U.S. spot Bitcoin ETFs recorded $21.435 million in net inflows on July 7, extending their inflow streak to three sessions.
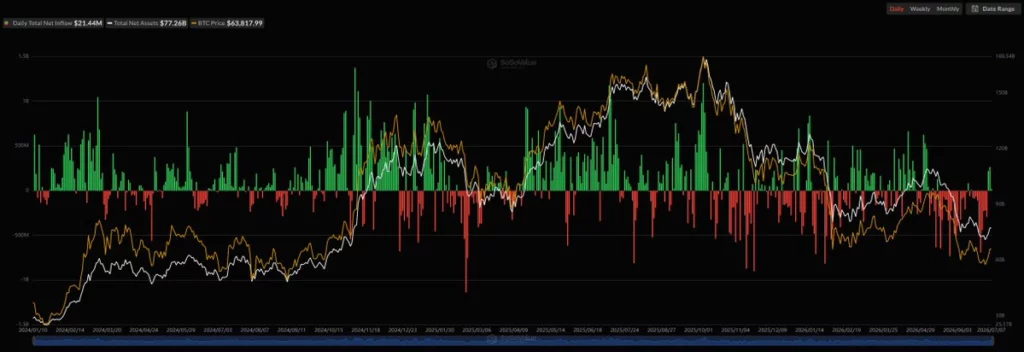
The inflow follows a stronger recovery earlier this month. As crypto.news reported, U.S. spot Bitcoin ETFs took in $221.7 million on July 2, ending a 10-day outflow streak after weaker jobs data eased some Federal Reserve rate fears.
ETF demand can support price when traders are still cautious, but it has not erased the wider pressure from geopolitics. The asset remains below the $65,000 zone, which traders are watching as the next clear resistance level.
A clean move above that area would show stronger demand. Until then, ETF inflows may slow the decline without confirming a full trend change. They also show that some institutional buyers are still adding exposure while short-term traders remain defensive.
Technical picture stays mixed
The BTC/USDT daily chart shows Bitcoin trying to recover from the sharp June selloff. Price has rebounded from the $58,000 to $60,000 area, but it still trades well below the May highs near $80,000 to $82,000.
The $60,000 level remains the key downside area. Holding above it keeps the short-term rebound alive, while a break below that level would put sellers back in control and could open another test of lower support.
The MACD has improved, with the histogram positive and the MACD line above the signal line. That shows short-term momentum has recovered from weaker levels. Still, both lines remain below zero, so the broader setup has not turned fully bullish.
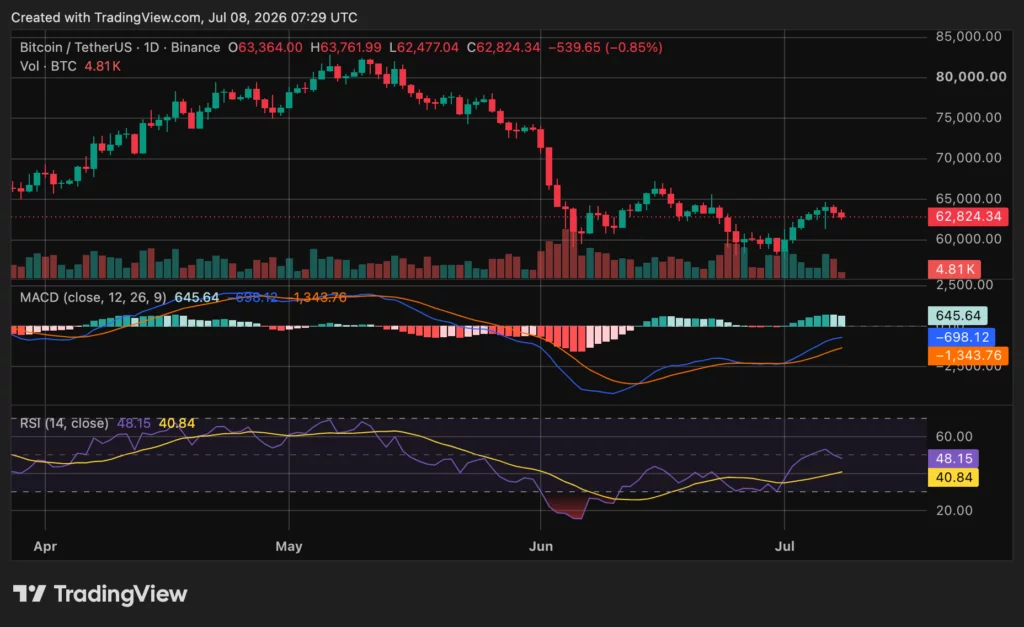
The RSI also shows a careful recovery. It sits near 48, above its moving average, but still below the neutral 50 level. That means buyers have improved their position, but they have not fully regained control.
Crypto analyst Crypto Patel wrote on X that BTC had printed its “first bearish quarterly close since Q4 2023.” He said Q3 could challenge the quarterly 50 EMA near $36,000, adding that holding that area would keep the macro structure alive, while losing it could invite deeper downside.
K33 sees late-cycle stress
Market data also shows growing stress among holders. K33 said more than 50% of all Bitcoin supply was held at a loss after the latest selloff pushed BTC below $60,000.
K33 said this metric has often appeared near the late stages of past BTC bear markets. When more than half of the circulating supply sits underwater, selling pressure can start to weaken because many sellers have already taken pain.
The firm also warned that the signal does not rule out one more drop. Past cycles sometimes produced a final downside move before the market formed a stronger bottom.
Bitcoin’s setup remains divided. ETF inflows and improving short-term indicators support a rebound attempt, while war risk, a stronger dollar, and weak quarterly momentum keep pressure on the market. Bulls need a move above $65,000 to improve the outlook. Bears need a break below $60,000 to regain control.
Disclosure: This article does not represent investment advice. The content and materials featured on this page are for educational purposes only.