XRP price at $1.36: Can it recover above $1.50?


XRP has fallen 6.91% over the past seven days to $1.36, leaving the cryptocurrency below the $1.40 resistance level as technical indicators show continued selling pressure despite rising whale-related exchange withdrawals.
- XRP traded near $1.36 after losing 6.91% over seven days, according to CoinGecko market data.
- CryptoQuant recorded a 10.5 percentage point increase in Binance’s XRP whale outflow spread over six days.
- Santiment reported 0.92 bullish XRP comments per bearish comment, indicating more negative social media discussion.
- Technical indicators showed selling pressure near $1.40, with the Awesome Oscillator remaining below zero territory.
- Analyst EGRAG identified $1.13 and $1.00 as possible downside levels if XRP loses current support.
According to CoinGecko, XRP recorded a modest 0.13% decline over 24 hours, with daily trading volume reaching approximately $1.72 billion. The cryptocurrency held a market capitalization of around $86.06 billion, ranking fifth among digital assets. Trading activity declined nearly 19.70% from the previous day, while analysts identified $1.35 as immediate support.
XRP price struggles to recover above $1.40
XRP has remained under pressure after failing to sustain its September rally toward $1.60. The cryptocurrency previously recovered from August lows near $1.00, but its recent trading pattern has produced lower highs, indicating that buyers have struggled to maintain upward momentum.
During the latest daily session, XRP traded around $1.36313 after opening at $1.36480. The token briefly reached $1.38518 before retreating, keeping the 1.38–1.40 region in focus as immediate resistance.
Chart analysis shows $1.35 as the nearest support level, followed by a stronger buying area between $1.30 and $1.32. A sustained decline below $1.30 could expose 1.20–1.25, where previous trading activity suggests buyers may attempt another recovery.
On the upside, reclaiming $1.40 would provide an early indication of improving market conditions. XRP would then face resistance near $1.45, followed by the 1.50–1.60 region that limited its earlier rally.
Recent XRP price analysis around the $1.40 support level identified a similar struggle in early October. At the time, XRP traded closer to $1.45, while traders monitored whether the cryptocurrency could maintain its recovery.
The latest decline has pushed XRP below that earlier support region, leaving buyers facing another test before the market can establish a stronger short-term recovery.
Technical indicators show sellers remain in control
The daily chart’s Balance of Power indicator stood at -0.07, suggesting that selling activity slightly exceeded buying pressure during the measured period.
Although the reading remained close to neutral, its negative position coincided with XRP’s inability to recover above $1.40. A move into positive territory could indicate improving demand, particularly if the cryptocurrency begins closing above nearby resistance.
The Awesome Oscillator presented a similar picture. The indicator stood at -0.06068, with red histogram bars below the zero line, showing weaker short-term momentum compared with the longer-term price trend.
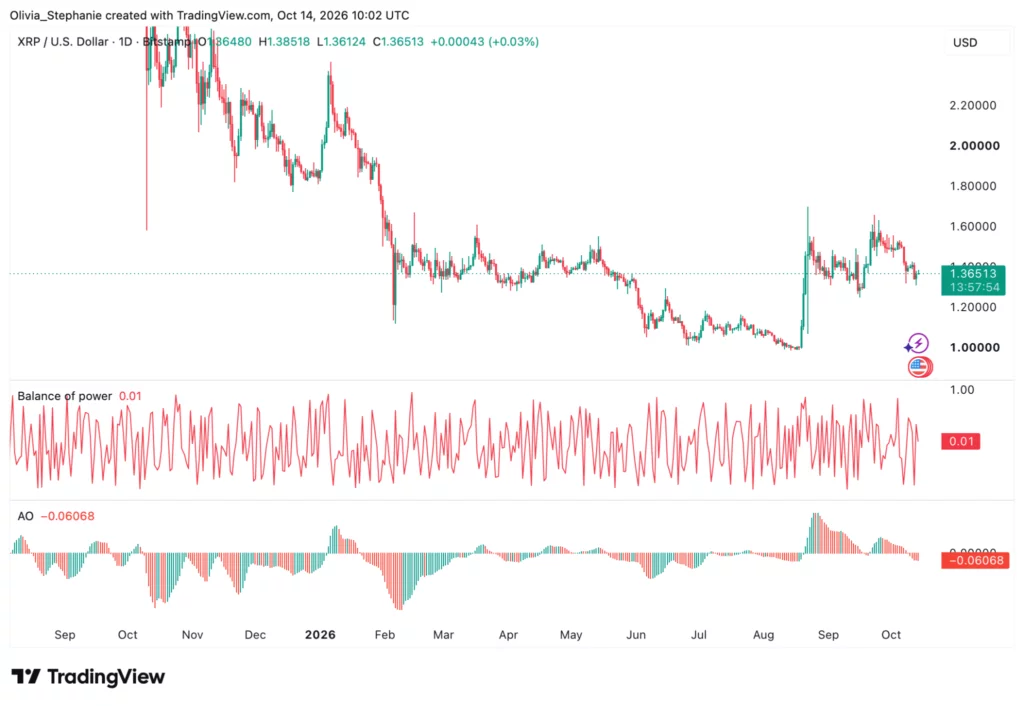
During September’s recovery toward $1.60, the indicator had moved into positive territory as buying momentum strengthened. The subsequent decline pushed it back below zero, suggesting that the earlier recovery had lost strength.
Further negative readings could increase the likelihood of XRP testing $1.30. Conversely, an improvement toward zero, followed by positive histogram bars, would provide an early technical indication that selling pressure was easing.
The current chart structure therefore places $1.35 and $1.40 at the center of the short-term outlook. Losing the lower level could extend the correction, while reclaiming the upper level would give buyers an opportunity to challenge $1.45.
XRP whale withdrawals rise sharply on Binance
Despite the weak price structure, exchange data has shown an increase in the relative dominance of large XRP withdrawals on Binance.
CryptoQuant analyst Amr Taha reported that Binance’s seven-day average whale-to-retail outflow spread increased from 53% on October 7 to 63.5% on October 13.
The 10.5-percentage-point increase was considerably larger than the change across all centralized exchanges. The combined market reading rose from 46% to 47.7%, representing an increase of just 1.7 percentage points.
Binance’s spread therefore increased approximately 6.2 times faster in percentage-point terms during the six-day period.
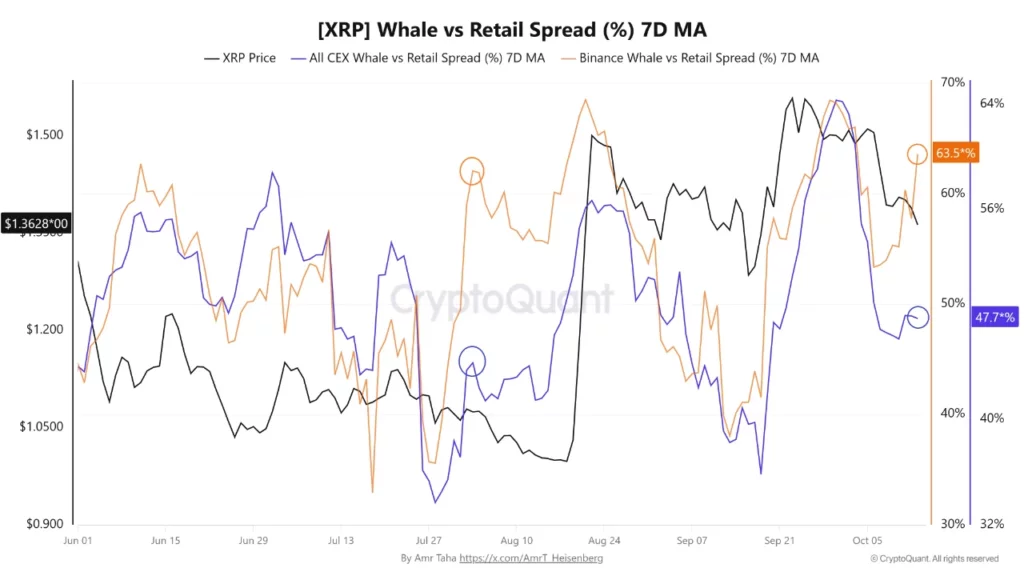
The metric compares large and small exchange withdrawals over a seven-day average. A higher reading indicates that large transfers are becoming more dominant relative to smaller withdrawals.
However, Taha cautioned that the indicator does not establish whether the absolute number of whale withdrawals has increased. It cannot independently confirm accumulation, as transfers between exchanges, custody services and private wallets may produce similar readings.
The gap between Binance and the combined exchange market reached 15.8 percentage points, approaching the approximately 18-point difference recorded on August 3.
During that earlier period, Binance’s spread stood near 62%, compared with 44% across all exchanges. XRP subsequently climbed from approximately $1.07 to $1.56, representing a gain of roughly 46%.
The analyst identified the historical comparison but did not establish that the latest increase would produce another price rally.
Separately, Crypto commentator CW described XRP’s technical structure as showing an accumulation signal, citing its moving average and MACD trends. The assessment suggested improving buying activity despite sideways trading, although the supplied daily indicators continued to show weaker short-term momentum.
XRP faces bearish sentiment as analysts watch $1
Public sentiment has remained cautious despite the increase in whale-related exchange withdrawals.
Blockchain analytics firm Santiment reported that XRP recorded 0.92 bullish comments for every bearish comment across X, Reddit and Telegram.
The reading placed XRP in negative sentiment territory, with bearish discussion exceeding positive commentary. Bitcoin recorded a lower ratio of 0.82, while Ethereum attracted 2.05 bullish comments for every bearish one.
Santiment linked XRP’s negative sentiment to its recent price decline, leveraged position liquidations and repeated difficulty recovering above $1.40.
The firm suggested that bearish sentiment could support a contrarian recovery if market conditions improve. However, social commentary alone does not confirm whether investors are buying XRP or whether a price rebound is approaching.
Crypto analyst EGRAG Crypto outlined two possible scenarios based on XRP’s three-day chart.
His bearish scenario identified $1.13 as a potential downside level if the current consolidation fails, followed by a possible decline toward $1.00.
For a recovery, the analyst identified $2.10 as an initial target following an upward breakout. His longer-term projection considered $17.60 possible only after XRP confirms a breakout above $3.68.
In a separate analysis, EGRAG identified a multi-year symmetrical triangle with potential upside levels between $4.30 and $10.23. His extended projections included $15.93, $33 and $60, all conditional on a confirmed breakout from the larger chart formation.
He emphasized that his long-term targets were scenarios, not guaranteed prices, while acknowledging that XRP could revisit $1.00 before establishing a stronger upward trend.
The cryptocurrency’s previous all-time high stood at $3.65, leaving its latest price approximately 62.55% below that record.
Disclosure: This article does not represent investment advice. The content and materials featured on this page are for educational purposes only.