Chainlink price falls 18% despite bullish $19.50 call: Can LINK recover?


Chainlink price has rebounded toward $13 after retreating from its late-September peak, with support at the 50-day moving average and an analyst’s $16.50–$19.50 outlook putting the recovery in focus.
- Chainlink price traded near $12.95, up 2.59% on the daily TradingView chart.
- The 50-day moving average stood at $12.59, below resistance at the $13.75 20-day average.
- Weekly Chaikin Money Flow remained positive at 0.15 despite the recent price correction.
- Team LAMBO Charts outlined a possible continuation toward $16.50–$19.50 while allowing for another pullback.
TradingView’s Binance LINK/USDT daily chart showed Chainlink trading at $12.952 on Oct. 13, following a session low of $12.259 and a high of $13.193. The rebound placed LINK above its 50-day simple moving average, although the token remained below its shorter-term trend line.
Against the late-September high near $15.74, LINK was still down approximately 17.7%. A recovery toward $13 has reduced part of that decline, but the daily chart continued to show a series of lower highs following the September rally.
Chainlink price faces its first recovery test at $13.75
The daily TradingView chart placed the 20-day simple moving average at $13.746, roughly 6.1% above LINK’s price. The 50-day average stood at $12.592, creating a relatively narrow gap between nearby support and overhead resistance.
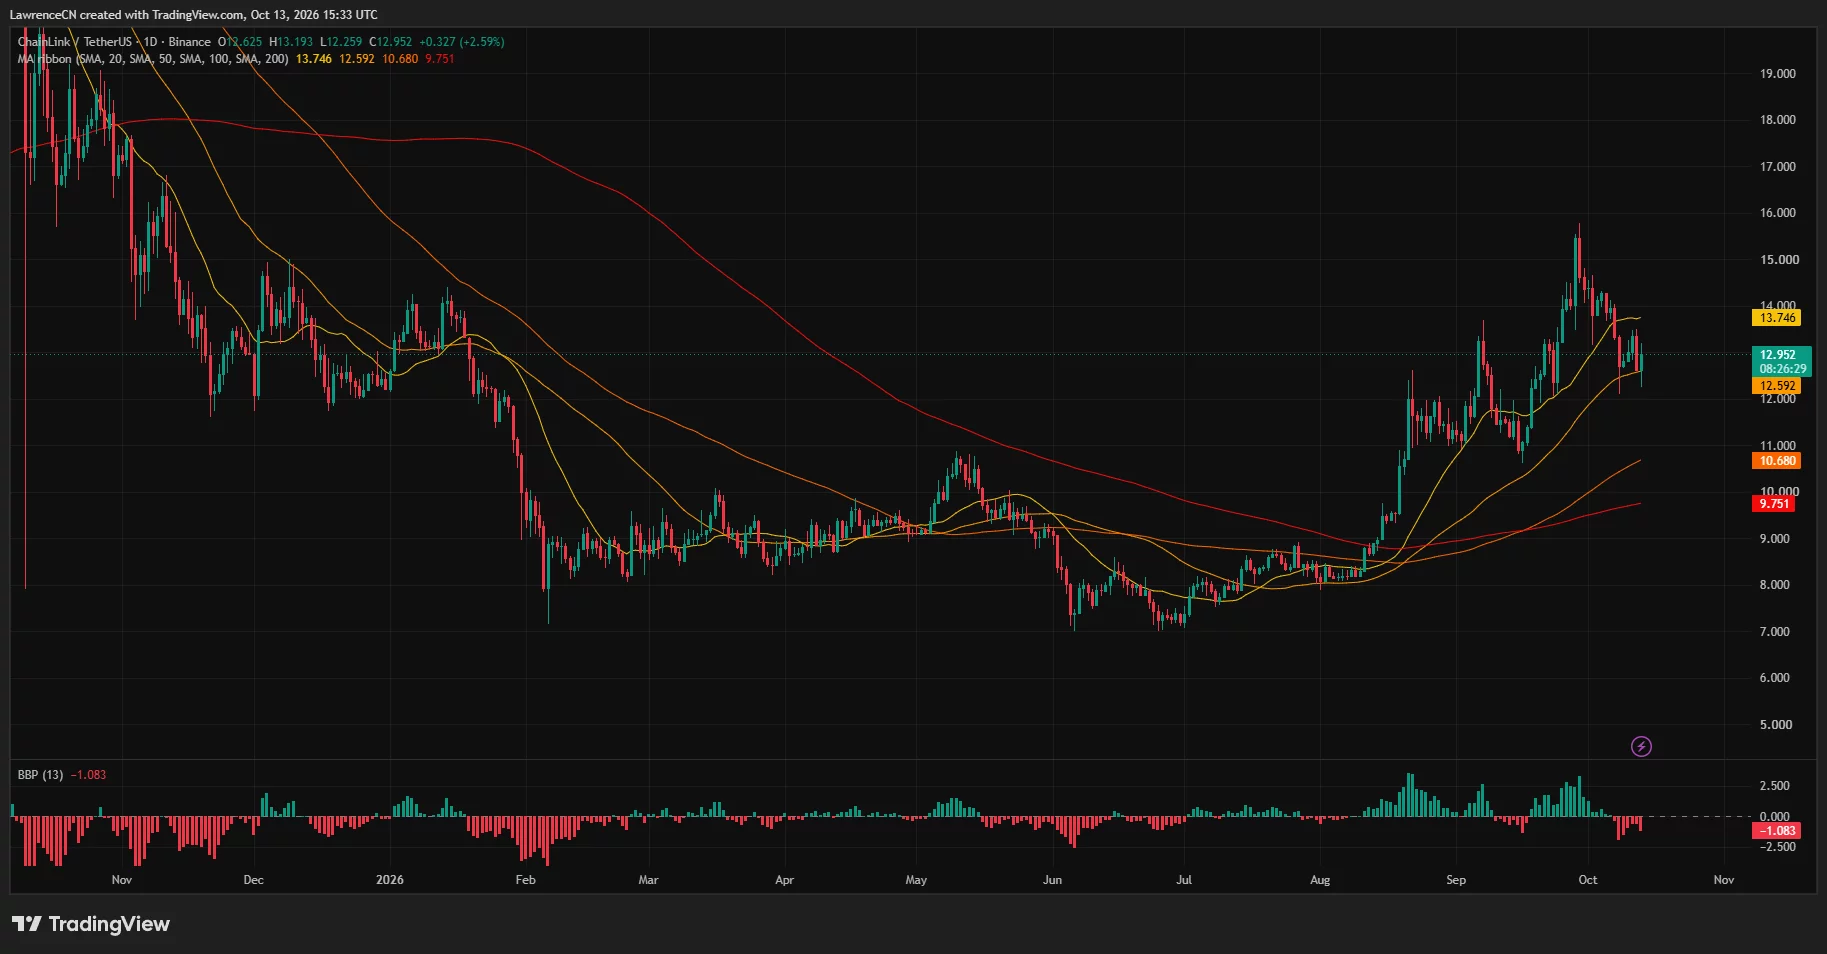
LINK’s latest session moved below the 50-day average before rebounding above it. The session low of $12.259 therefore provides another reference point beneath $12.59, alongside the recent price lows around $12.
On the daily chart, a sustained move above $13.75 would reclaim the shorter-term average lost during the correction. The recent trading area around $14 would then become the next nearby reference, followed by the September peak around $15.74.
The longer-term averages remained below the market. TradingView recorded the 100-day SMA at $10.680 and the 200-day SMA at $9.751, leaving LINK above both despite its retreat from September’s high.
The moving-average arrangement shows a split between timeframes: LINK has lost its position above the 20-day average while retaining its position above the 50-day, 100-day, and 200-day averages.
Daily momentum was weaker. The Bull Bear Power indicator stood at minus 1.083, with red histogram bars following the positive readings seen during the September advance. The latest price rebound had therefore not yet returned that indicator above zero.
Weekly buying pressure remains positive after the pullback
TradingView’s weekly LINK/USDT chart showed a price of $12.922 and a weekly decline of 3.19%. The displayed weekly range extended from $12.259 to $13.506.
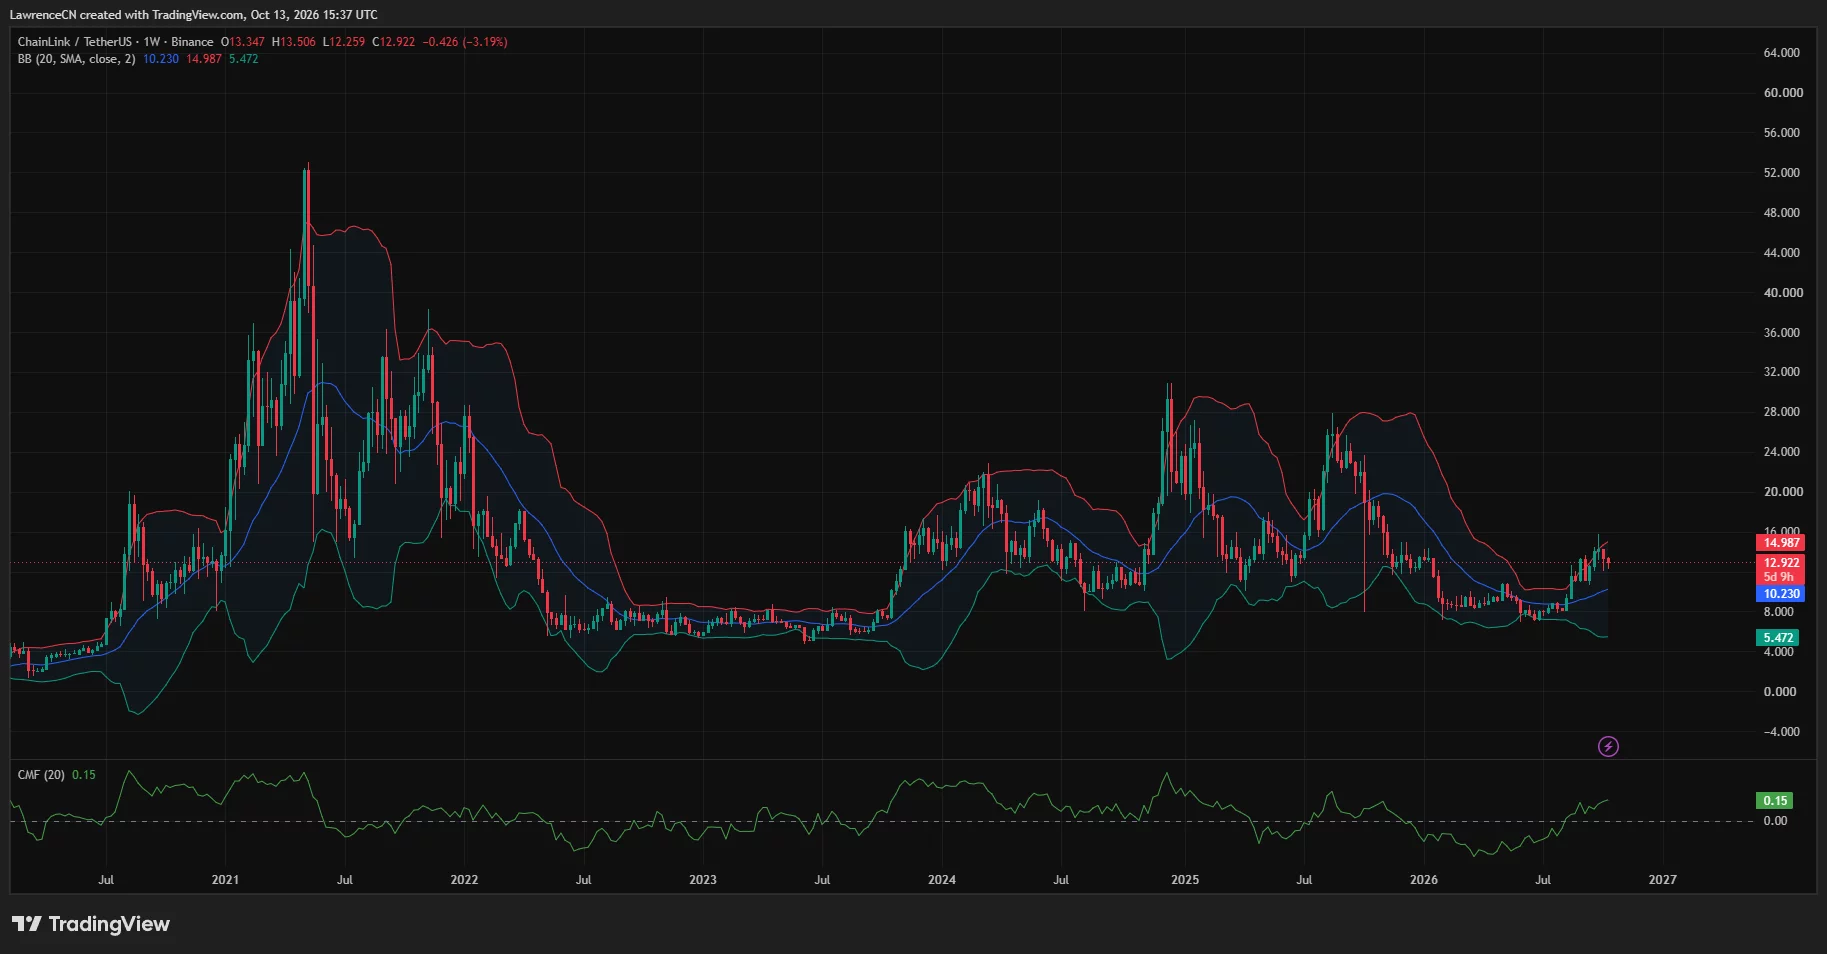
The weekly Bollinger Bands placed the middle line at $10.230, the upper band at $14.987, and the lower band at $5.472. LINK remained above the middle line after retreating from its late-September push beyond the upper band.
The upper band near $15 provides a separate weekly reference below the recent peak. A return to that area would require a gain of about 16% from $12.92, before any attempt to revisit $15.74.
Weekly Chaikin Money Flow stood at 0.15. The indicator remained above zero during the pullback, contrasting with the negative Bull Bear Power reading on the daily chart.
The weekly chart also showed LINK holding well above the roughly $7–$8 trading area seen earlier in 2026. October’s correction has reduced the September advance without returning the token to that earlier base.
For U.S. investors following LINK’s dollar value, the immediate price references remain clustered around $12.26–$12.59 below the market and $13.75–$15 above it. The Binance chart measures LINK against USDT, while the analyst’s longer-term setup uses Coinbase’s dollar-denominated market.
Liquidation bands cluster near $14.70 and $15.80
CoinGlass’s one-month liquidation heatmap showed several concentrations of estimated liquidation levels above LINK’s price.
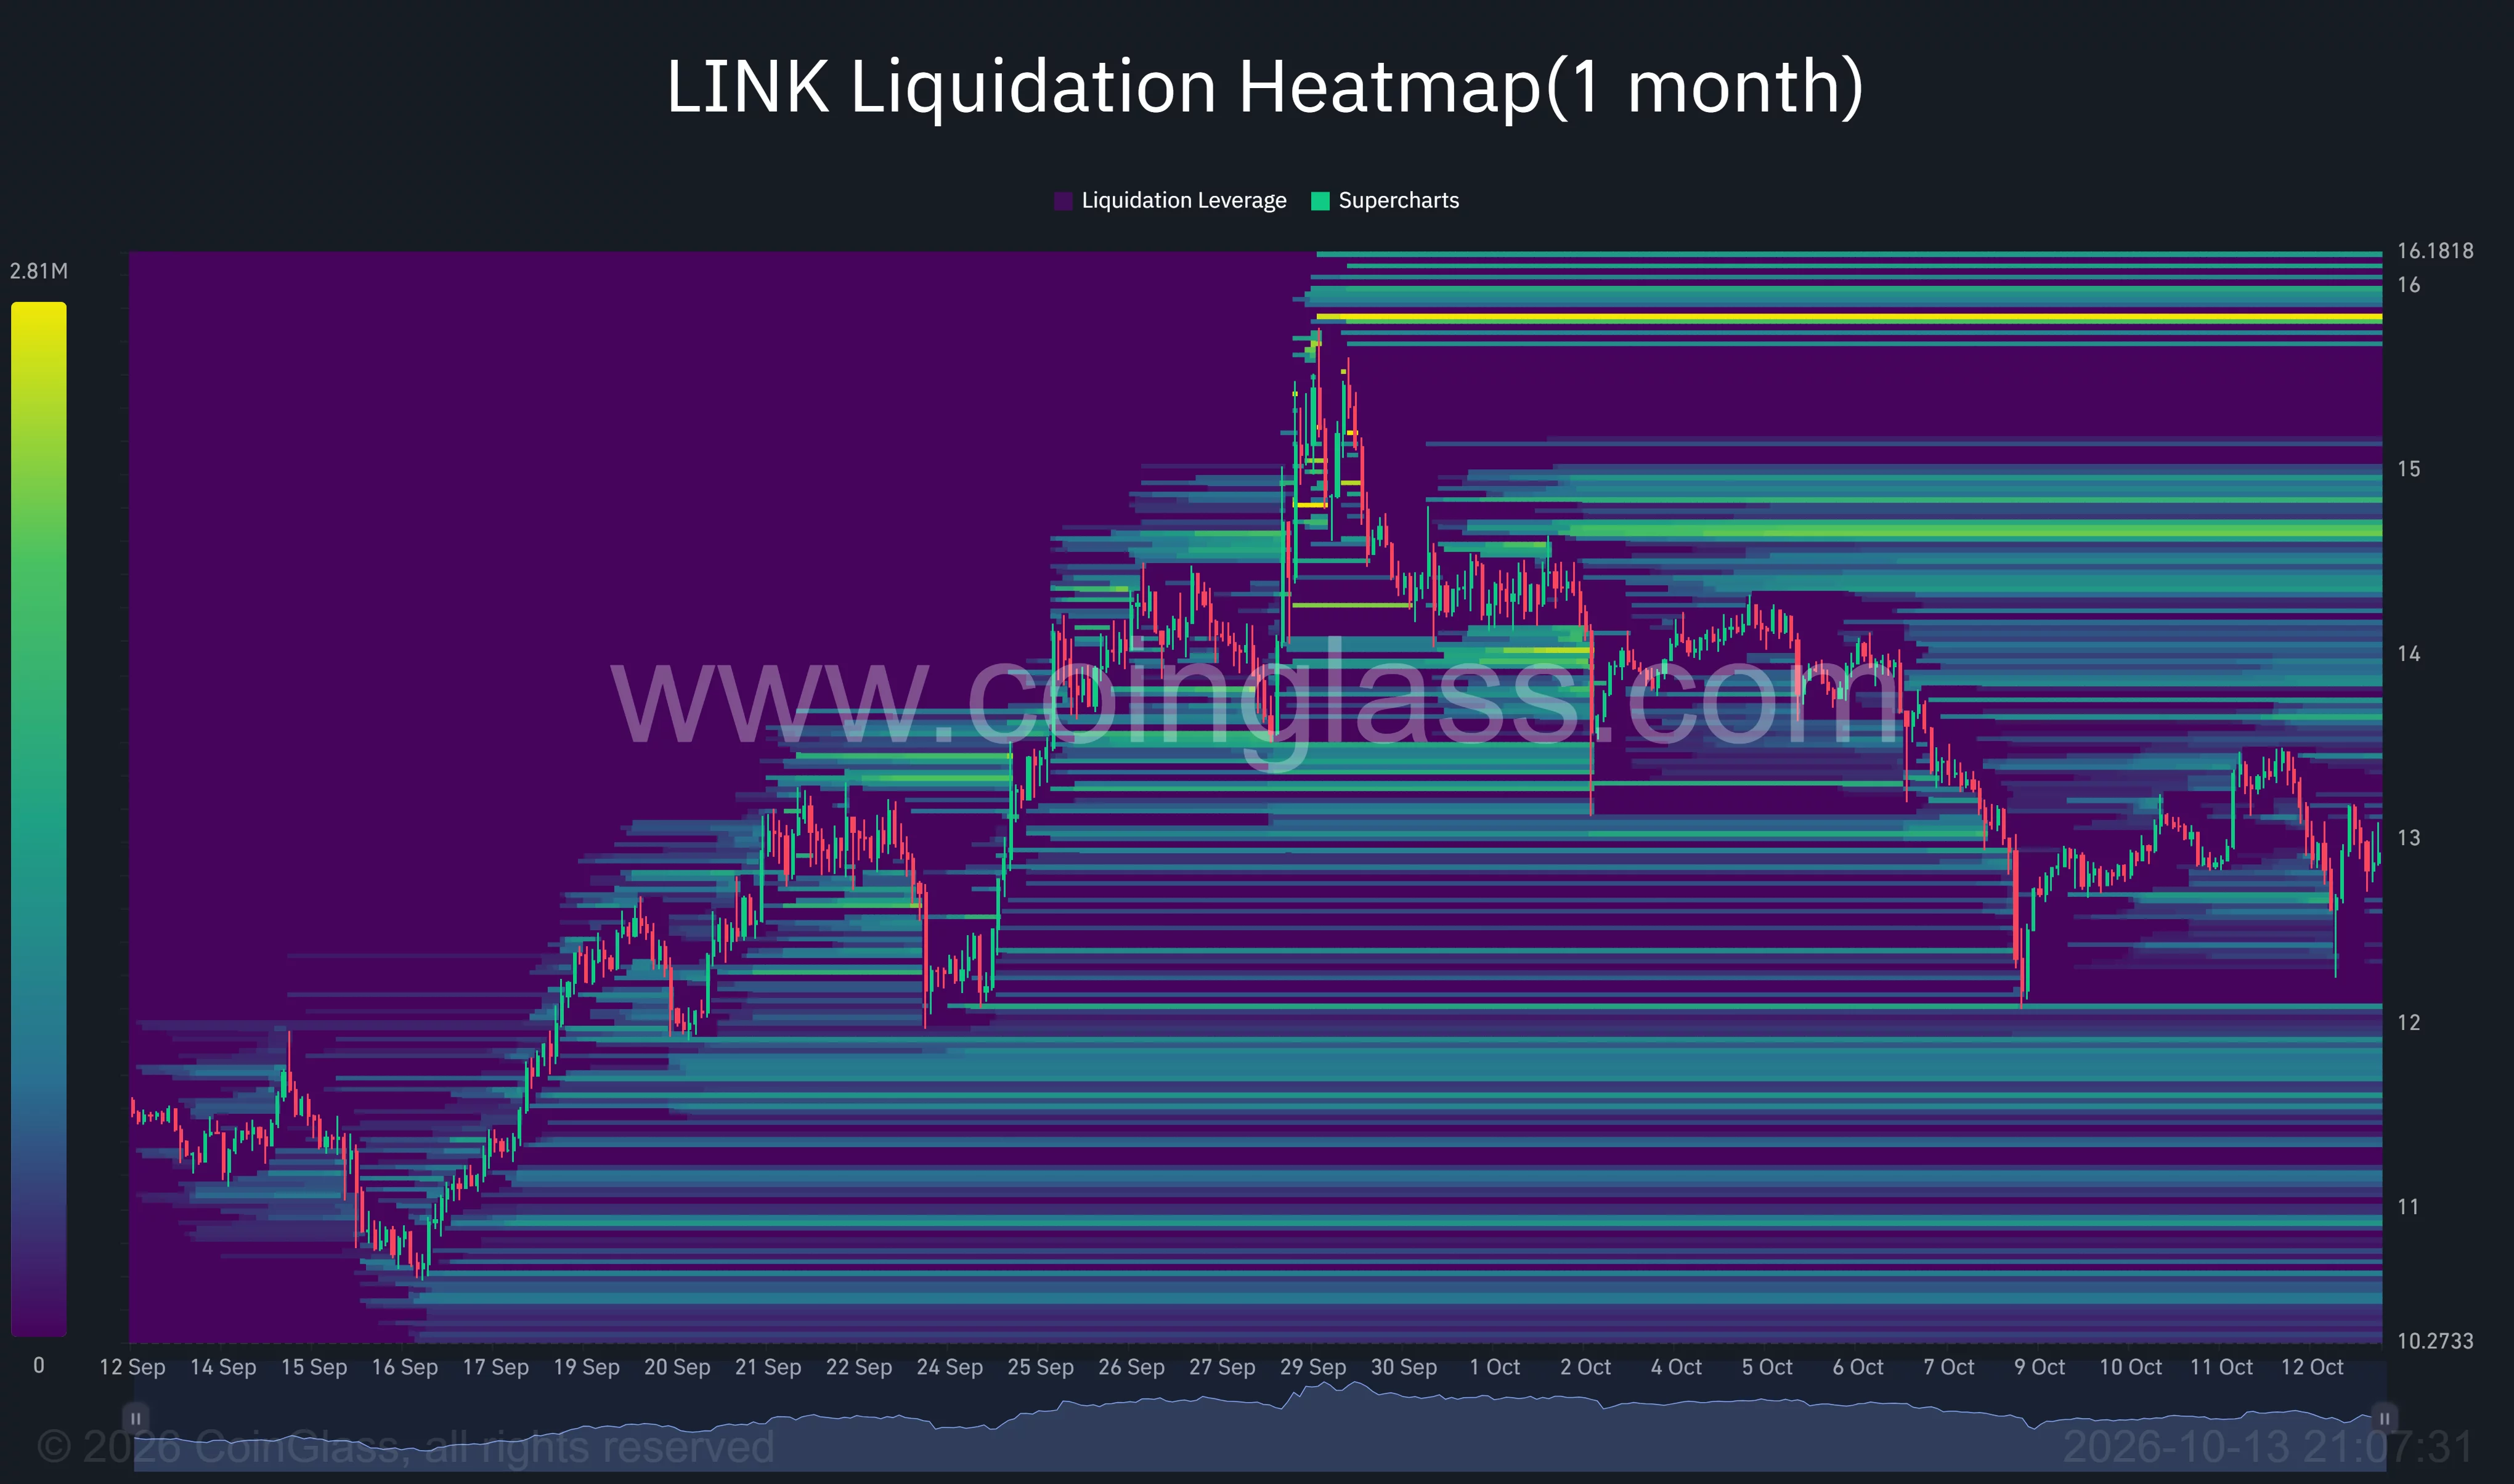
Visible bands appeared around $13.60–$13.80, followed by broader clusters near $14.60–$14.90. A particularly bright band stood around $15.80, with additional concentrations extending toward $16.
The first overhead cluster sits close to the daily 20-day moving average at $13.75. Higher bands around $14.70 and $15.80 overlap with price areas reached during the September rally.
Below the market, the heatmap showed bands around $12.10, $11.60–$11.90, and approximately $10.90–$11.20. Those levels provide derivatives-market reference points beneath the daily chart’s immediate support area.
CoinGlass’s price trace showed LINK falling toward $12.10 around Oct. 8, recovering above $13, and subsequently retreating again. The latest price action remained below the larger overhead concentrations near $14.70 and $15.80.
Analysts watch support as the $16.50 outlook stays conditional
Team LAMBO Charts described Chainlink’s recovery as solid and said the setup continued to develop as expected. The analyst allowed for another pullback while watching for a possible continuation toward $16.50–$19.50.
The accompanying Coinbase daily chart marked a support area around $10.50–$11 and an overhead zone near $16.50–$17. Its projected path included a further dip before a stronger advance.
From approximately $12.95, the analyst’s $16.50 level represents a gain of about 27%, while $19.50 would require roughly 51%.
Rand Group separately described LINK as bouncing above its main horizontal support while pressing into a local downtrend, calling the setup a key decision point.
Both views focus on whether support can hold through the correction. On TradingView’s daily chart, the nearest test remains $12.59, followed by the session low at $12.26; overhead, LINK still faces the $13.75 moving average before the higher levels in the analysts’ recovery outlook.
Disclosure: This article does not represent investment advice. The content and materials featured on this page are for educational purposes only.