DOT price rises 13.10% in week as crypto markets falter


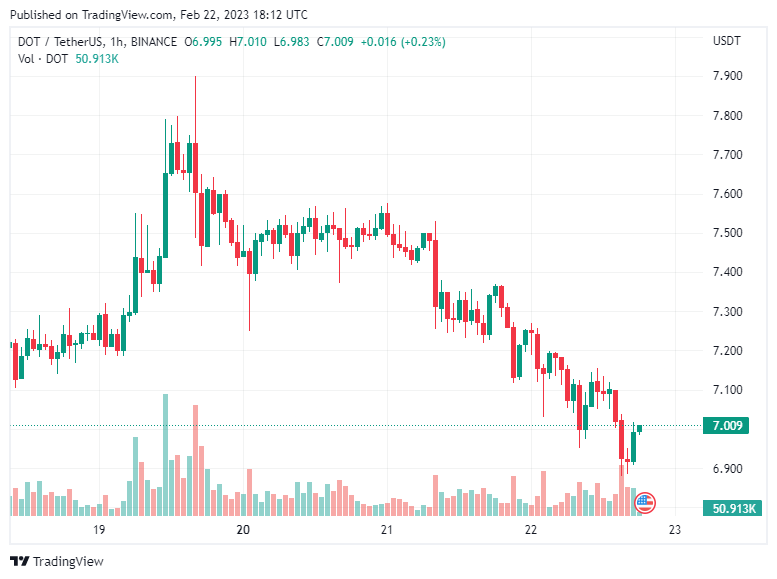
On Feb. 22, polkadot’s price managed to sustain a price rise trend recording a 13.10% increase over the past seven days despite a 24-hour decline.
Polkadot sustains its bullish trend
At the time of writing, the price of polkadot (DOT) was trading at $7.05, with a 24-hour trading volume of $435,710,098.
The market capitalization of polkadot is $8,507,253,140, and there is 1.2 billion DOT in circulation. Despite showing an overall positive trend over the past 7 days with a 13.10% increase in price, polkadot has experienced a negative decline in price over the last 24 hours, with a drop of -3.30%.
The market price of polkadot has seen its ups and downs since its launch. Polkadot recorded an all-time high of $54, which it achieved in April 2021.
However, the price has been on a descending trend since reaching its ATH. Several factors are at play for its collapse, but majorly were due to the failure experienced in the cryptocurrency industry. Despite this fall, the bulls have been aggressively pushing the price up from its bottom of $3.20.
On Jan.18, polkadot announced the deployment of an upgrade to its cross-consensus messaging (XCM) infrastructure, which is now live. The upgrade could be the reason why the token is surging swiftly.
Polkadot is a blockchain platform that enables secure and decentralized communication between diverse blockchains, allowing them to share their unique features and exchange value in a trust-free manner.
With its resourceful multi-chain technology, polkadot is scalable and capable of handling complex interactions between different blockchains.
Polkadot technical analysis: a positive trend
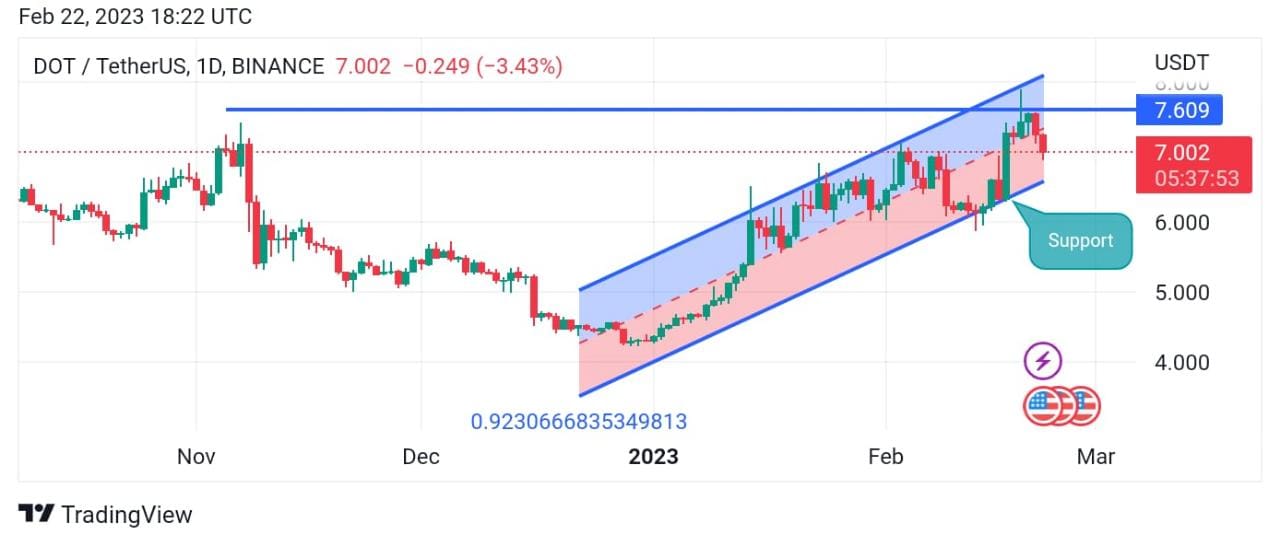
The second half of 2022 looks depressing for polkadot investors and traders. The market price of DOT experienced a dip nose dive in mid-November 2022, further escalated by the FTX crypto exchange collapse. DOT bottomed out at $3, only for the bulls to aggressively push the prices higher.
DOT is trading along the upward channel creating higher highs and higher lows. According to the chart above, the resistance at $7.40 looks strong enough for the price to break through. Besides that, DOT/USDT has formed a double top pattern which technically symbolizes the trend change from buying to selling.
Notably, the price is dropping, retracing to the lower line of the channel before picking up on the bull run. Almost all the indicators also signal a bullish rally on the price of DOT.
The moving averages, which mostly record the price of an asset in real-time, indicate buying pressure by the bulls. The cost of DOT is trading swiftly above the 200-day, and 50-day moving averages indicating the buying pressure is relatively high.
Meanwhile, the Relative Strength Index (RSI 14) trades above the 50-level mark, meaning that DOT’s price is bullish.