Ethereum price analysis: Harmonic pattern signals run to $3,200


Ethereum is currently trading at a critical resistance zone. A potential harmonic pattern is forming that could signal a deeper pullback before a major bullish continuation unfolds.
Ethereum’s (ETH) price action has reached a pivotal point, with the asset now trading at a high time frame resistance level of $2,590. This zone is technically significant, as it aligns with the 0.618 Fibonacci retracement and the midpoint of the active Fibonacci-based price channel. While bullish momentum remains intact, this region could act as a short-term ceiling, potentially triggering a corrective move that sets the stage for a larger breakout.
Three key technical points
- Ethereum is facing resistance at $2,590, a zone confluent with the 0.618 Fibonacci level and channel midpoint.
- A harmonic pattern (Butterfly) is potentially forming, requiring a corrective leg C before a bullish leg D continuation.
- High time frame support at $2,226 could be the target of a healthy pullback to complete leg C.
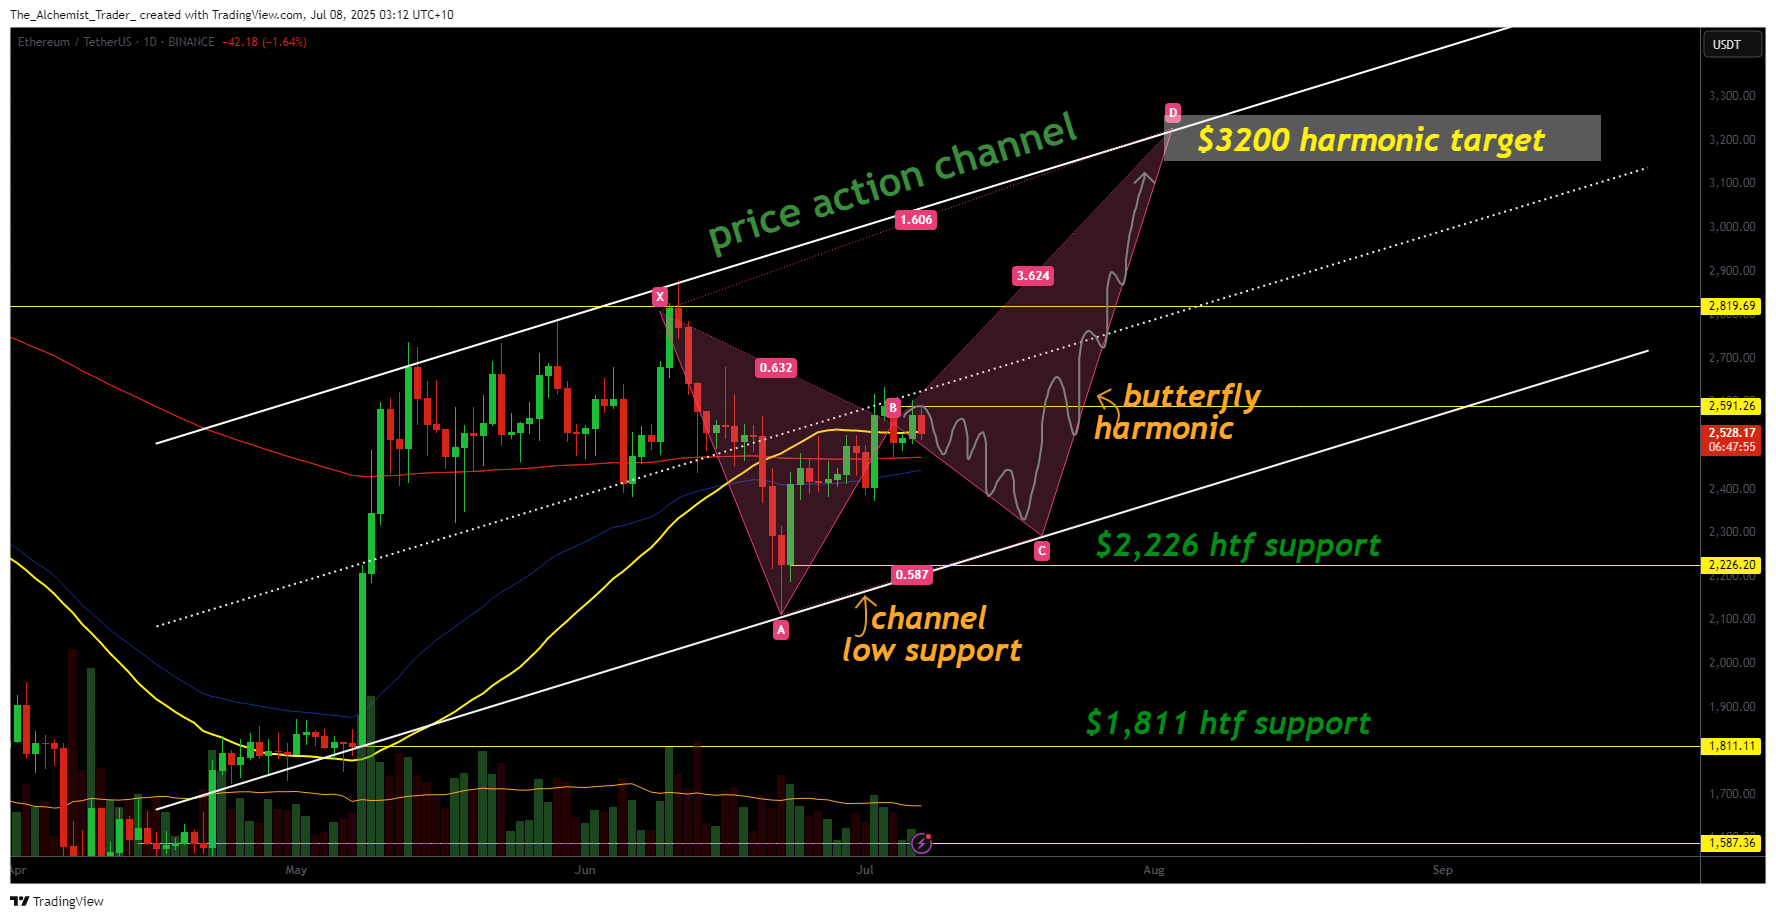
Ethereum has recently rallied into the $2,590 zone, a region marked by strong historical resistance and multiple layers of technical confluence. This level is not only a psychological round number but also aligns with the 0.618 Fibonacci retracement drawn from the previous high to the most recent swing low at $1,920. Additionally, this area coincides with the midpoint of the broader Fibonacci-based price channel that Ethereum has been trading within.
This confluence strengthens the case that Ethereum may temporarily stall at this level before resuming its upward trend. Notably, a potential Butterfly harmonic pattern is emerging within the current structure. For the setup to remain valid, a corrective leg C must form, implying a possible retracement toward the $2,226 region, where high time frame and channel support converge.
If price revisits this level and holds, it would confirm the formation of leg C and set the foundation for a bullish continuation into leg D. The projected target for leg D aligns with the $3,200 area, the upper boundary of the price channel and a key high time frame resistance zone.
Volume and structure will be critical in validating this scenario. Currently, volume remains muted, indicating that any breakout from this resistance level would require a notable surge in buyer interest to be sustainable.
What to expect in the coming price action
Ethereum remains bullish on higher time frames, but a pullback from $2,590 would be both expected and technically healthy. A move toward $2,226 could complete the harmonic structure, paving the way for a continuation toward $3,200, assuming support holds and volume picks up on the next leg higher.