


XRP price holds $1 as whale inflows to Binance hit 2021 low, can it rebound?


XRP price has steadied near $1 as whale transfers to Binance fell to their lowest level since 2021, although weak demand and bearish chart signals continue to limit a recovery.
- XRP price traded near $1.00 after losing about 3.2% over the past seven days.
- Binance whale inflows fell to $61 million on a three-month average.
- Daily RSI remained weak at 36, while the 4-hour MACD showed early improvement.
- Liquidation clusters between $1.02 and $1.05 could attract price during a rebound.
XRP price remains under pressure near $1
CryptoQuant contributor Darkfost reported that the three-month average of XRP whale inflows to Binance has dropped to about $61 million, its lowest reading since 2021.
The figure stood at $456 million in January 2025 and $355 million in October 2025. Current transfers are therefore six to eight times lower than the peaks recorded last year, according to the analyst.
Reduced exchange deposits usually mean fewer tokens are immediately available for sale. Darkfost described the decline as a positive development for XRP but warned that lower selling activity alone cannot confirm a bullish reversal.
Net flows remain positive at roughly $18.8 million, meaning large deposits are still exceeding withdrawals. Darkfost also said the slowdown fits a market-wide decline in exchange inflows and trading volume, with selling pressure fading before demand has fully recovered.
XRP traded around $1.00 at the time of writing, little changed over 24 hours, but down approximately 3.2% during the past week. The token has a market capitalization of about $62.8 billion and nearly $900 million in daily trading volume.
XRP price has repeatedly moved above and below $1 since Aug. 11. The latest dip reached approximately $0.988 before buyers returned, but the recovery stopped near $1.01.
Daily XRP chart keeps sellers in control
The daily chart shows XRP trading below the Bollinger Bands’ 20-day middle line at $1.0446. Staying below that average leaves the short-term structure tilted toward sellers, even though the price is approaching the lower band at $0.9866.
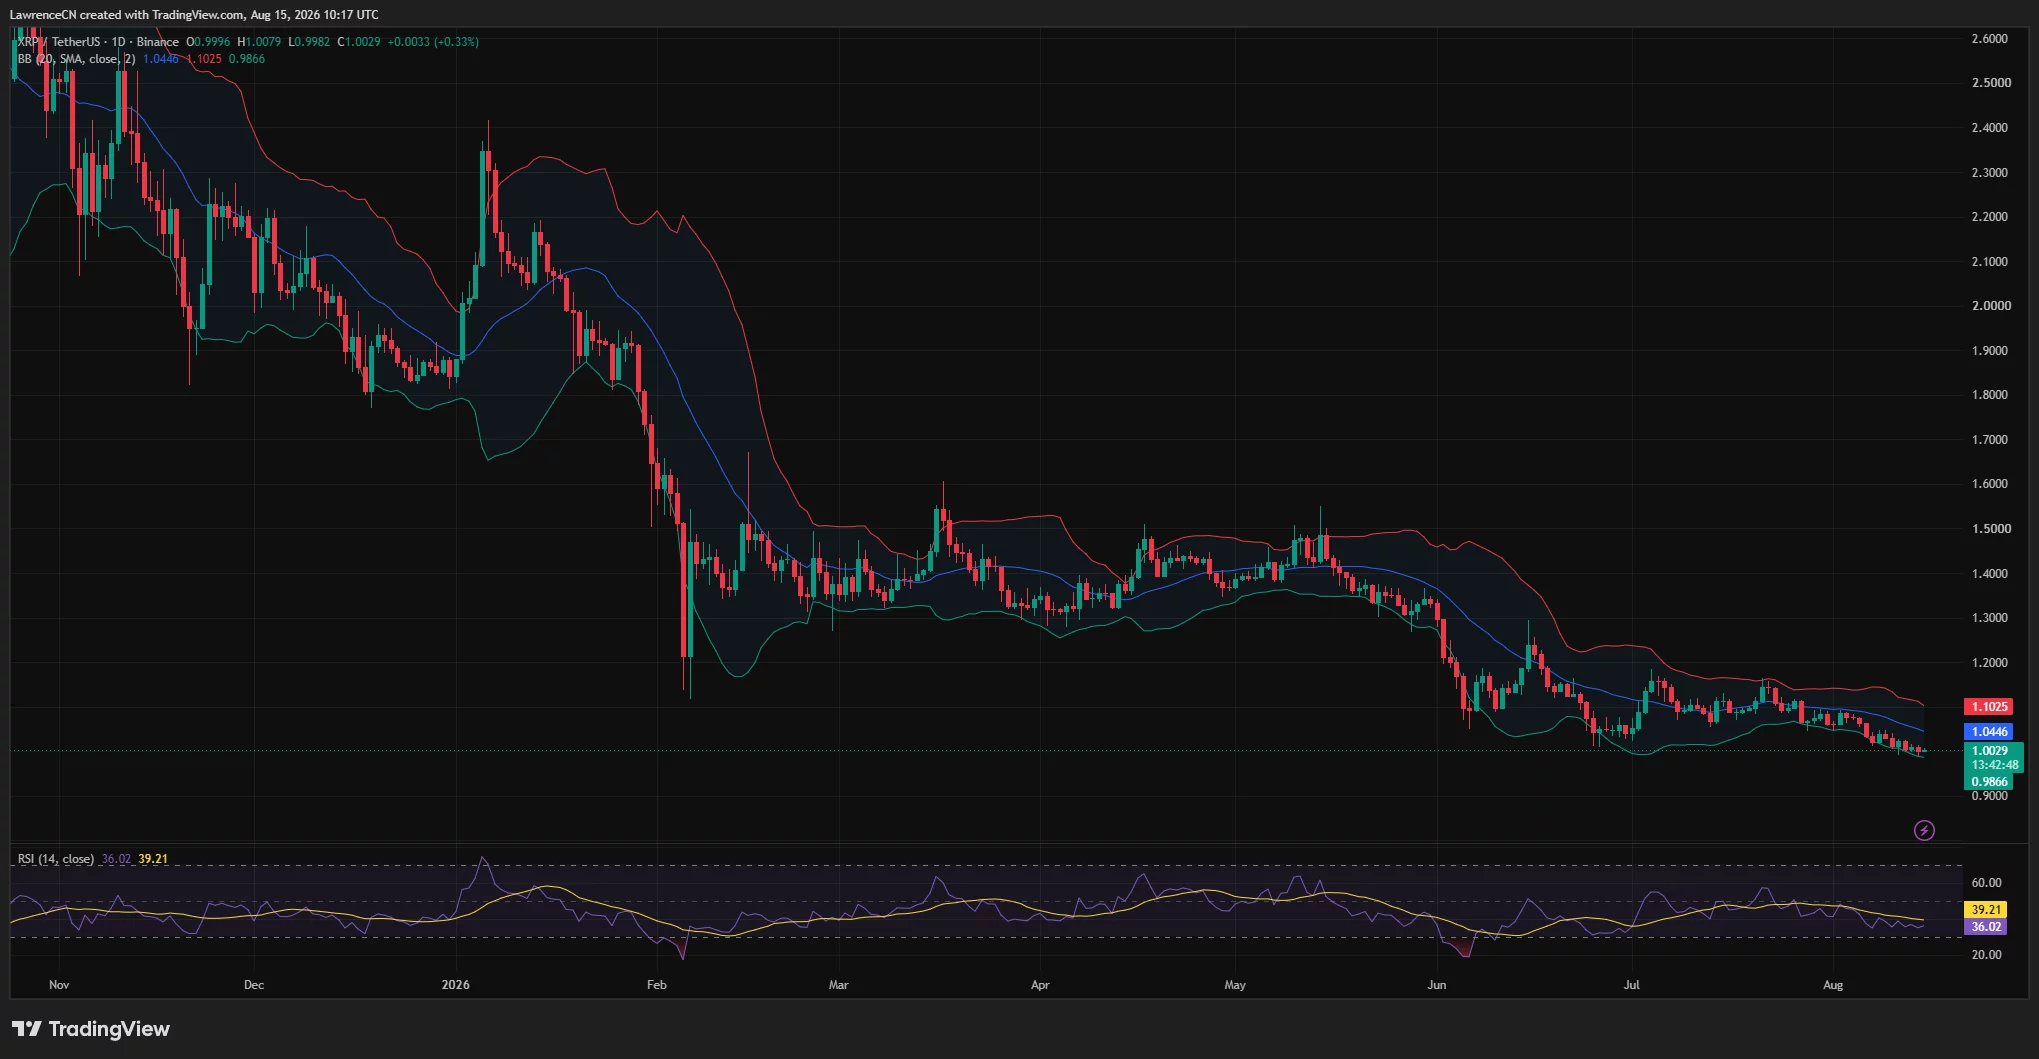
The daily relative strength index stood at 36.02, below its signal average of 39.21. The reading shows weak momentum but remains above the conventional oversold threshold of 30, leaving room for another decline before the indicator reaches an extreme.
A close below the $0.9866 lower Bollinger Band would weaken the $1 support case and expose the area around $0.95. The chart has not established a clear daily reversal pattern, with lower highs and lower lows continuing from XRP’s May peak.
For a recovery, buyers first need to reclaim the Bollinger middle line near $1.045. The upper band at $1.1025 would become the next target if the price closes above that level and trading activity rises.
The narrow distance between the current price and the lower band also creates the possibility of a short-term bounce. Such a move would remain corrective unless XRP breaks above its declining daily average and holds the gain.
Falling wedge offers an early recovery setup
On the 4-hour chart, XRP has moved inside a falling wedge formed after the July 21 high near $1.165. Price is now close to the point where the two descending trendlines converge, making a breakout increasingly likely as the available trading range contracts.
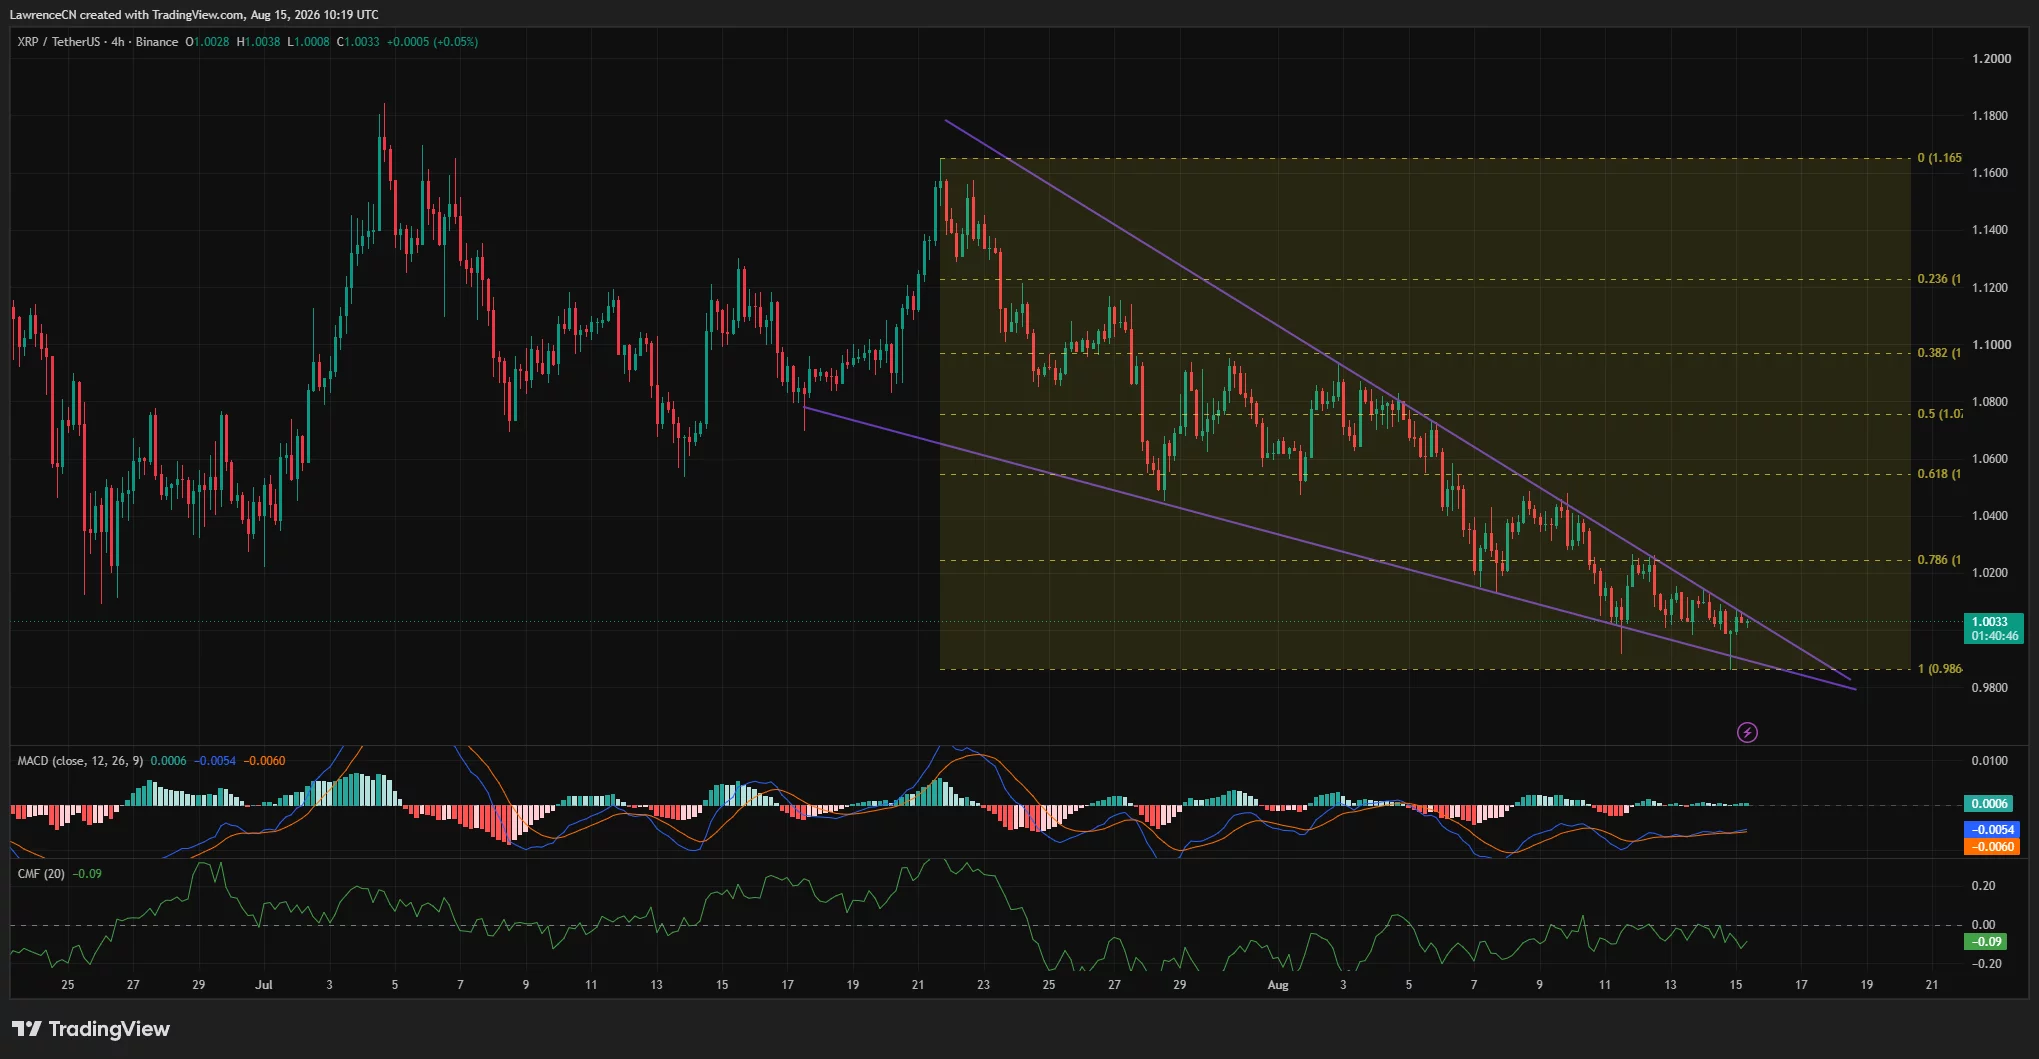
The first nearby barrier sits at the 78.6% Fibonacci retracement around $1.024. A breakout above the wedge and this level would open a path toward $1.055, followed by $1.076.
Higher resistance appears near $1.097 and $1.123. XRP would need to clear the entire sequence before it could challenge the July high around $1.165.
4-hour momentum has started to improve. The MACD line stood near minus 0.0054, above the signal line at minus 0.0060, while the histogram turned slightly positive at 0.0006. The crossover points to easing downside momentum rather than a confirmed trend change because both lines remain below zero.
Chaikin Money Flow remained negative at minus 0.09, showing that capital flows still favor sellers. A wedge breakout accompanied by CMF moving above zero would provide firmer evidence that buyers are returning.
Failure to leave the wedge could push XRP back toward $0.986. A confirmed 4-hour close below the lower trendline would invalidate the recovery setup and increase the risk of a move toward $0.98 or $0.95.
Liquidation map places XRP targets above $1
CoinGlass’ one-week liquidation heatmap shows several leveraged-position clusters above the current price. The nearest liquidity is concentrated around $1.01, followed by larger pockets between $1.02 and $1.03.
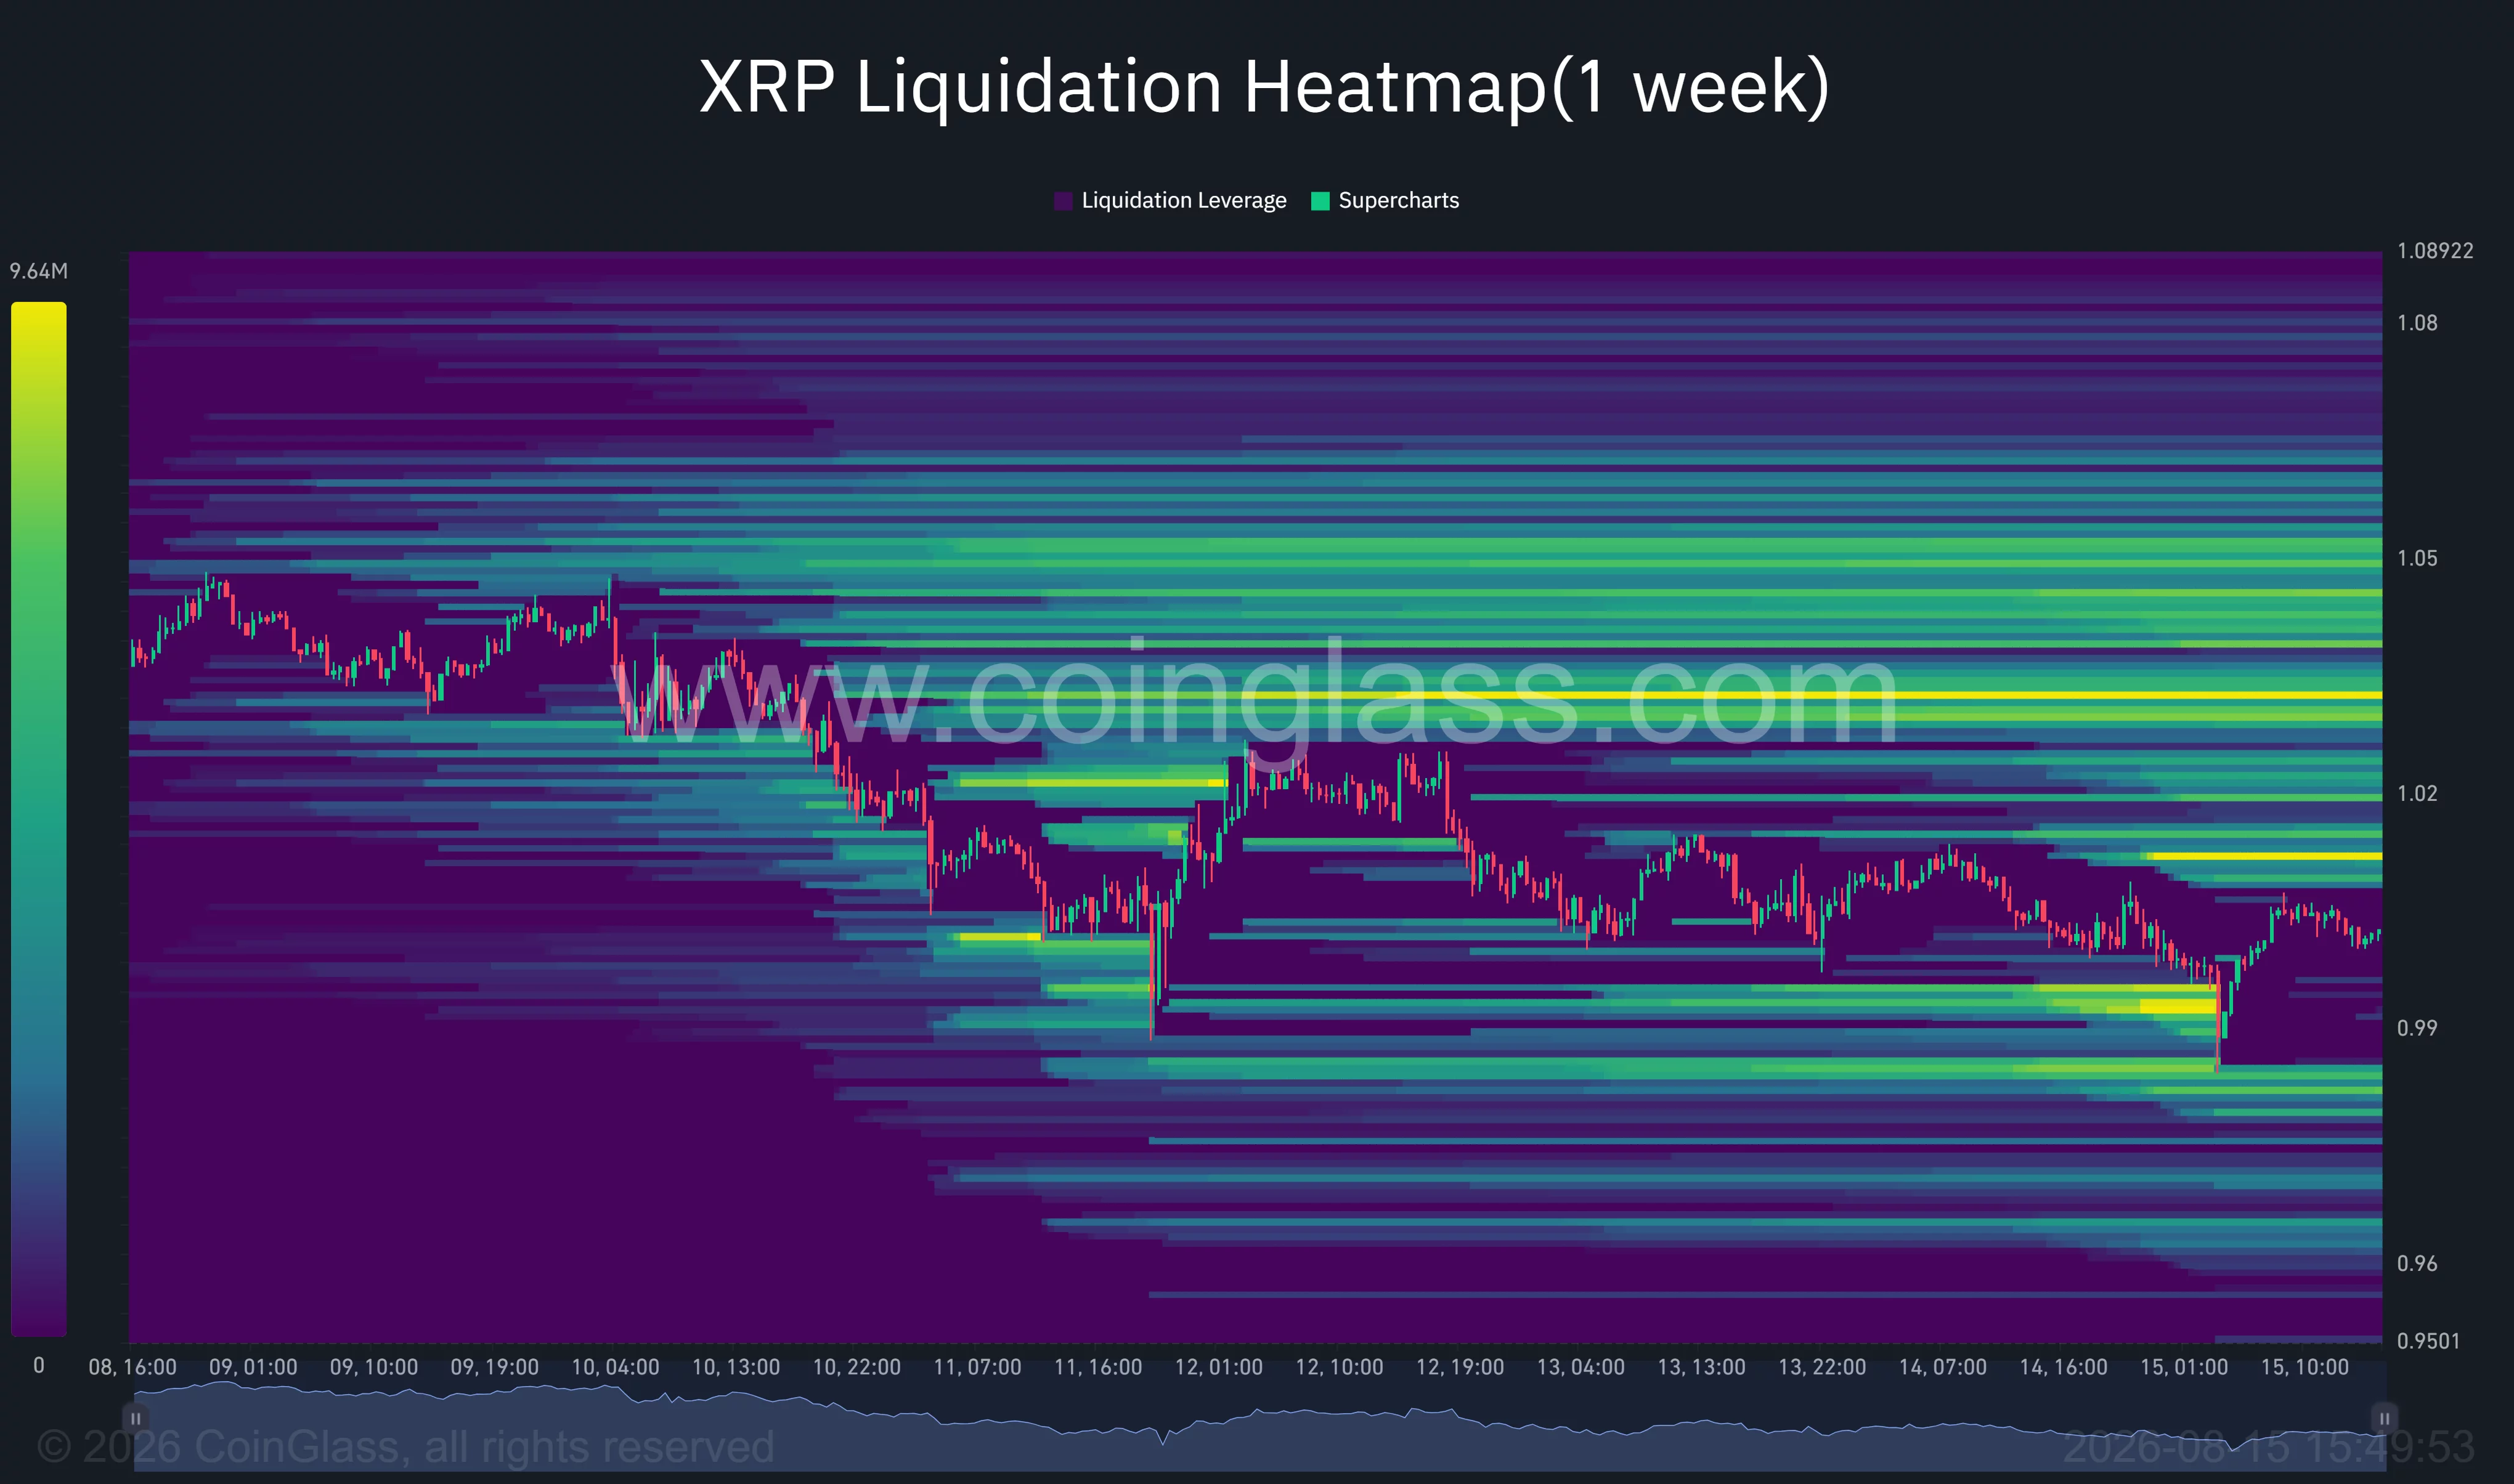
The strongest overhead concentrations appear near $1.03 and from approximately $1.045 to $1.05. Since price often moves toward areas holding large leveraged positions, a rebound could accelerate as short liquidations are triggered across these levels.
Additional liquidity below the market is visible near $0.98 to $0.99. A loss of $1 could therefore pull XRP toward that zone before buyers receive another chance to defend the daily lower Bollinger Band.
For US investors trading during the weekend, thinner liquidity may increase sudden moves around the $1 level. The charts place $0.986 as the immediate downside boundary, while a move through $1.024 would offer the first technical sign that XRP is breaking out of its month-long decline.
Falling Binance whale inflows reduce one source of possible selling, but Darkfost’s data and the negative daily structure reach the same conclusion: XRP still needs fresh buying demand before a lasting recovery can begin.
Disclosure: This article does not represent investment advice. The content and materials featured on this page are for educational purposes only.