HYPE price coils within falling wedge, breakout could trigger 54% rally


HYPE price looks poised for a bullish breakout from a falling wedge pattern as multiple catalysts, including a listing on Robinhood, spurred renewed investor interest in the token.
- HYPE price has rallied 19% over the past 7 days.
- Robinhood has listed HYPE, and Hyperliquid Strategies Inc. announced plans to raise funds to accumulate the token.
- HYPE is close to breaking out of a falling wedge pattern on the 4-hour chart.
According to data from crypto.news, Hyperliquid (HYPE) was trading at $40 last check, Oct. 24, morning Asian time, up 8.1% over the past 24 hours and nearly 19% from its lowest point in the past 7 days. However, when zooming the charts, the token still lies 33.6% below its year-to-date high.
A series of notable developments has helped rekindle momentum around the token recently.
First, U.S.-based popular trading platform Robinhood officially listed Hyperliquid yesterday, giving it access to a broader retail user base across the U.S.
A listing on Robinhood significantly boosts visibility for the asset while also laying the foundation for stable demand over the longer term.
Second, on the same day Robinhood listed HYPE, Hyperliquid Strategies Inc. filed an S-1 registration with the U.S. Securities and Exchange Commission to raise up to $1 billion through a stock offering. The firm stated that a portion of the proceeds would be used to purchase and stake HYPE tokens, a development that stirred renewed community discussions among the Hyperliquid community.
HYPE’s gains have also been supported by medical technology company ENDRA Life Sciences’ disclosure of a $3 million purchase of HYPE tokens as part of its new digital asset treasury strategy.
According to the company, the HYPE tokens will form the cornerstone of its active treasury management approach, signaling growing institutional confidence in the long-term utility and value proposition of the Hyperliquid ecosystem.
These events converge at a time when HYPE is approaching a technical inflection point, a breakout from which could open the door to further upside in the days ahead.
HYPE price analysis
On the 4-hour chart, HYPE price has been forming a falling wedge pattern since early September, characterized by gradually lower highs and lower lows converging toward a narrowing range. A breakout from this type of pattern typically signals a bullish reversal.
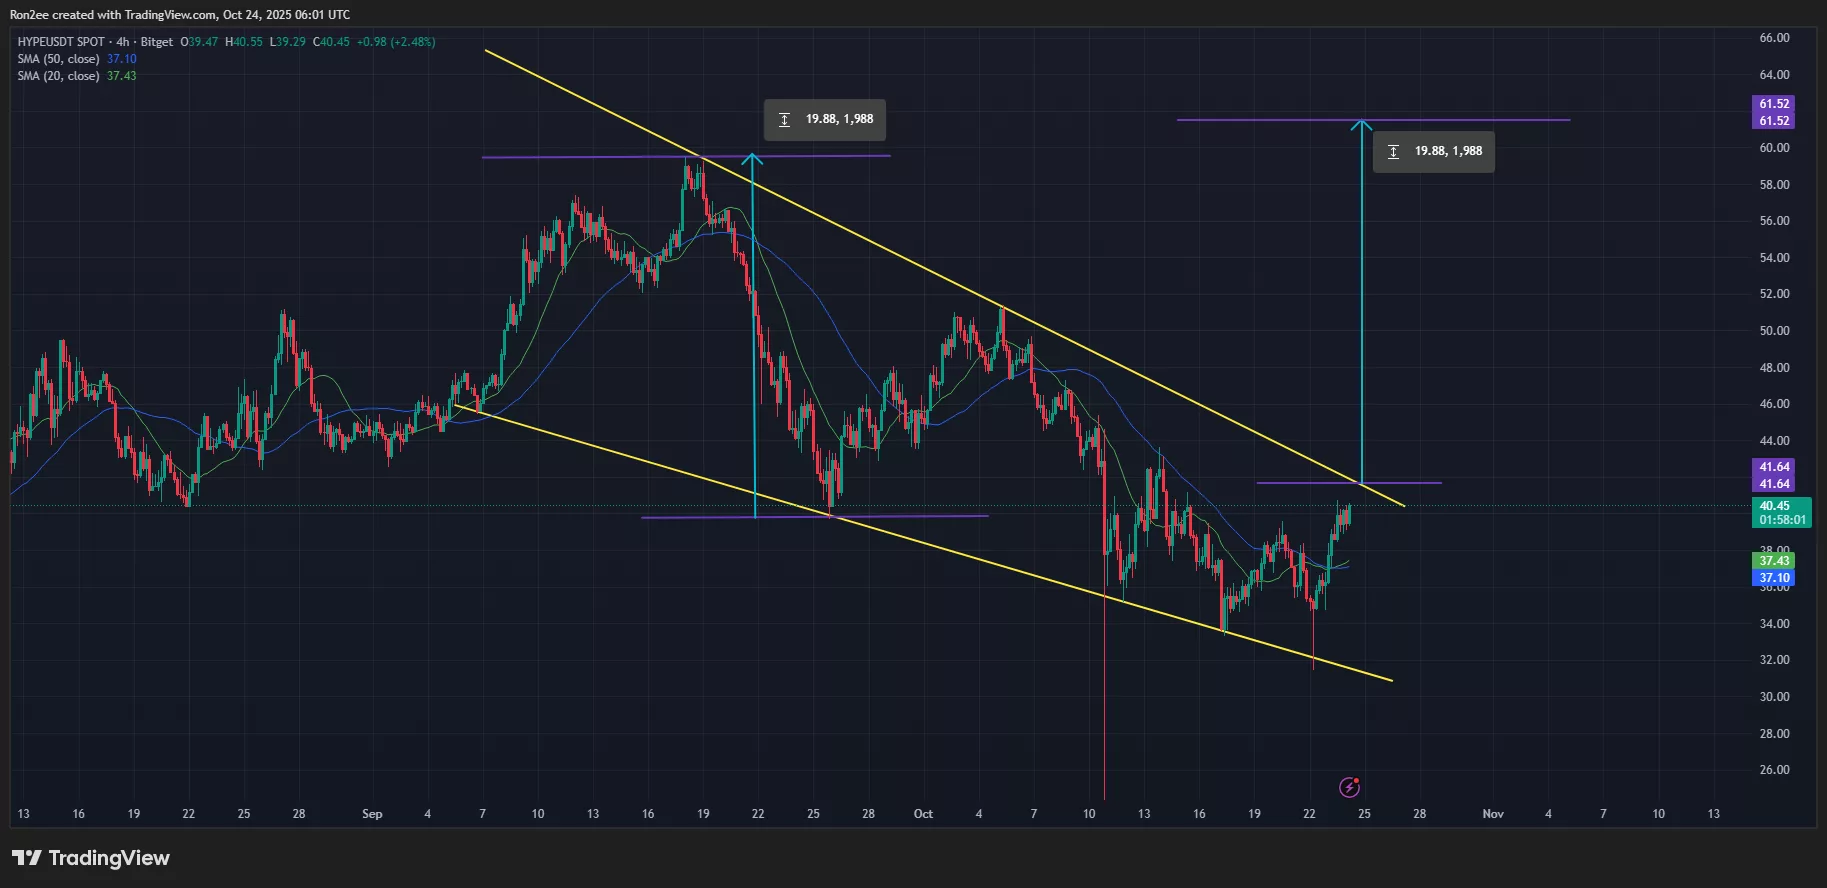
At the time of writing, HYPE was trading close to the upper boundary of the falling wedge at the $41 to $42 zone.
A strong move above this range, backed by solid trading volume, could give bulls the momentum to push toward the $61.5 level that lies 54% above the current price level. This target is derived by measuring the height of the wedge at its widest point and projecting it upward from the breakout zone.
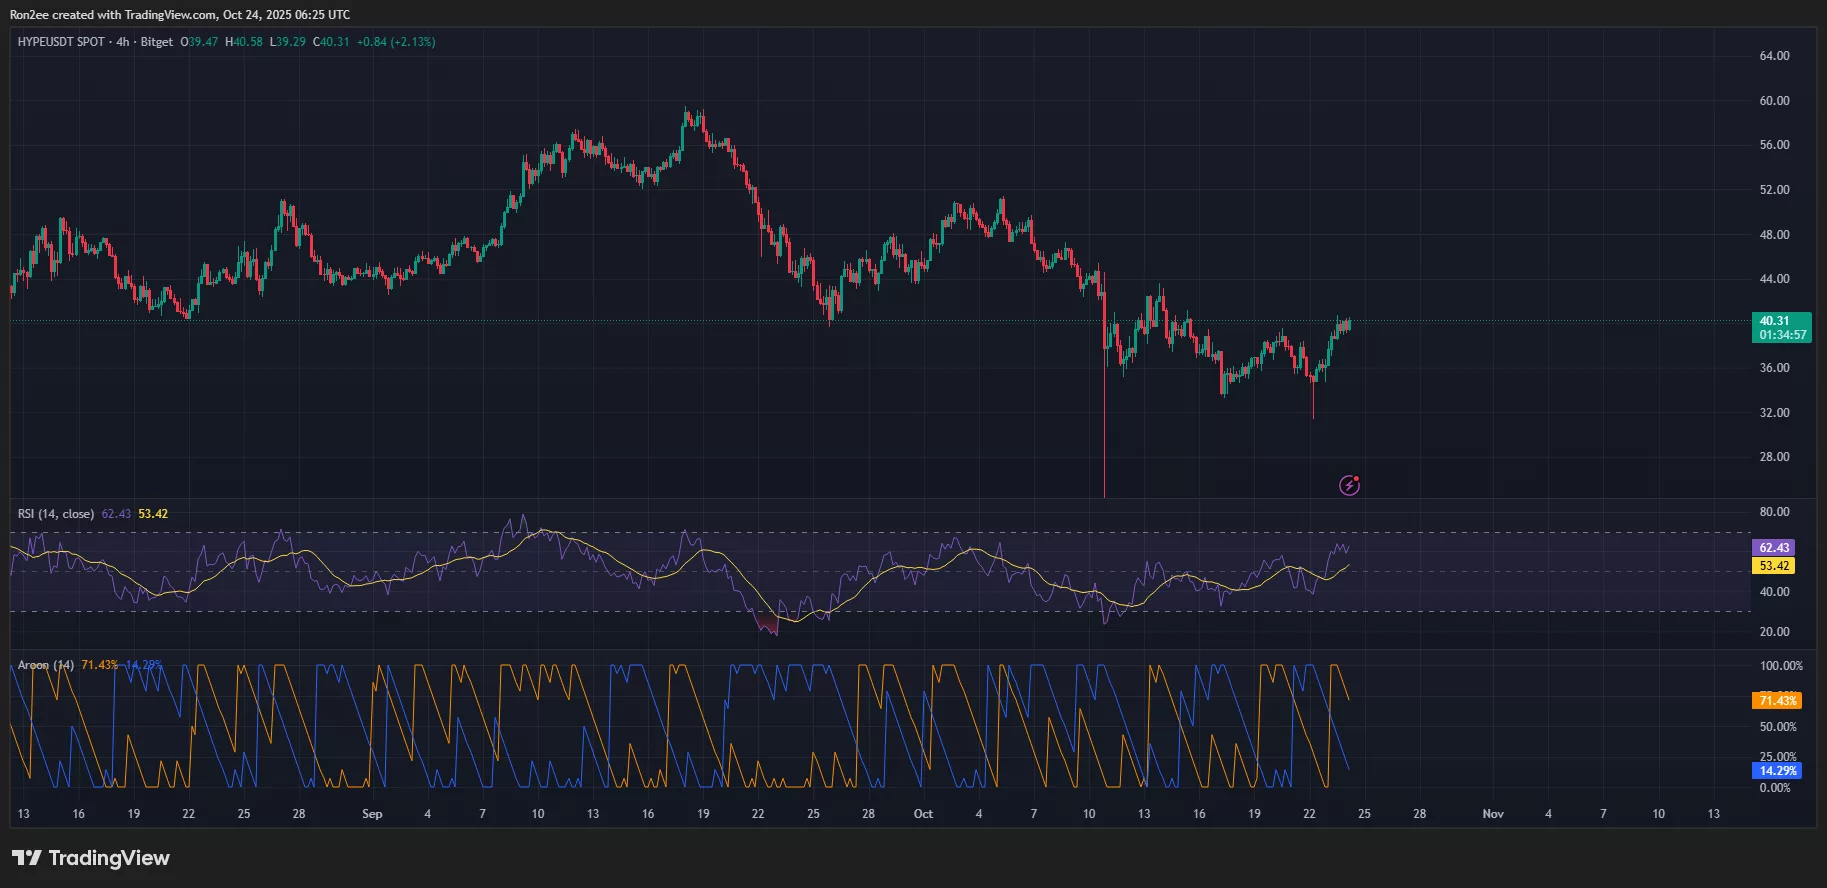
Closer analysis of technical indicators also adds weight to the bullish case. Notably, the Aroon Up indicator stood at 71.4 % while the Aroon Down was at 14.29 %, suggesting buyers are currently in control. The RSI has also bounced back from the neutral 50 zone and remains below overbought territory, indicating there’s still room for upward movement without triggering immediate correction signals.
According to the 24-hour liquidation heatmap from CoinGlass, a notable cluster of short liquidations is visible between the $41 and $42 range, coinciding with the upper boundary of the falling wedge pattern. A decisive breakout above this zone could trigger a cascade of liquidations, adding fuel to upward momentum as overleveraged short positions get wiped out.
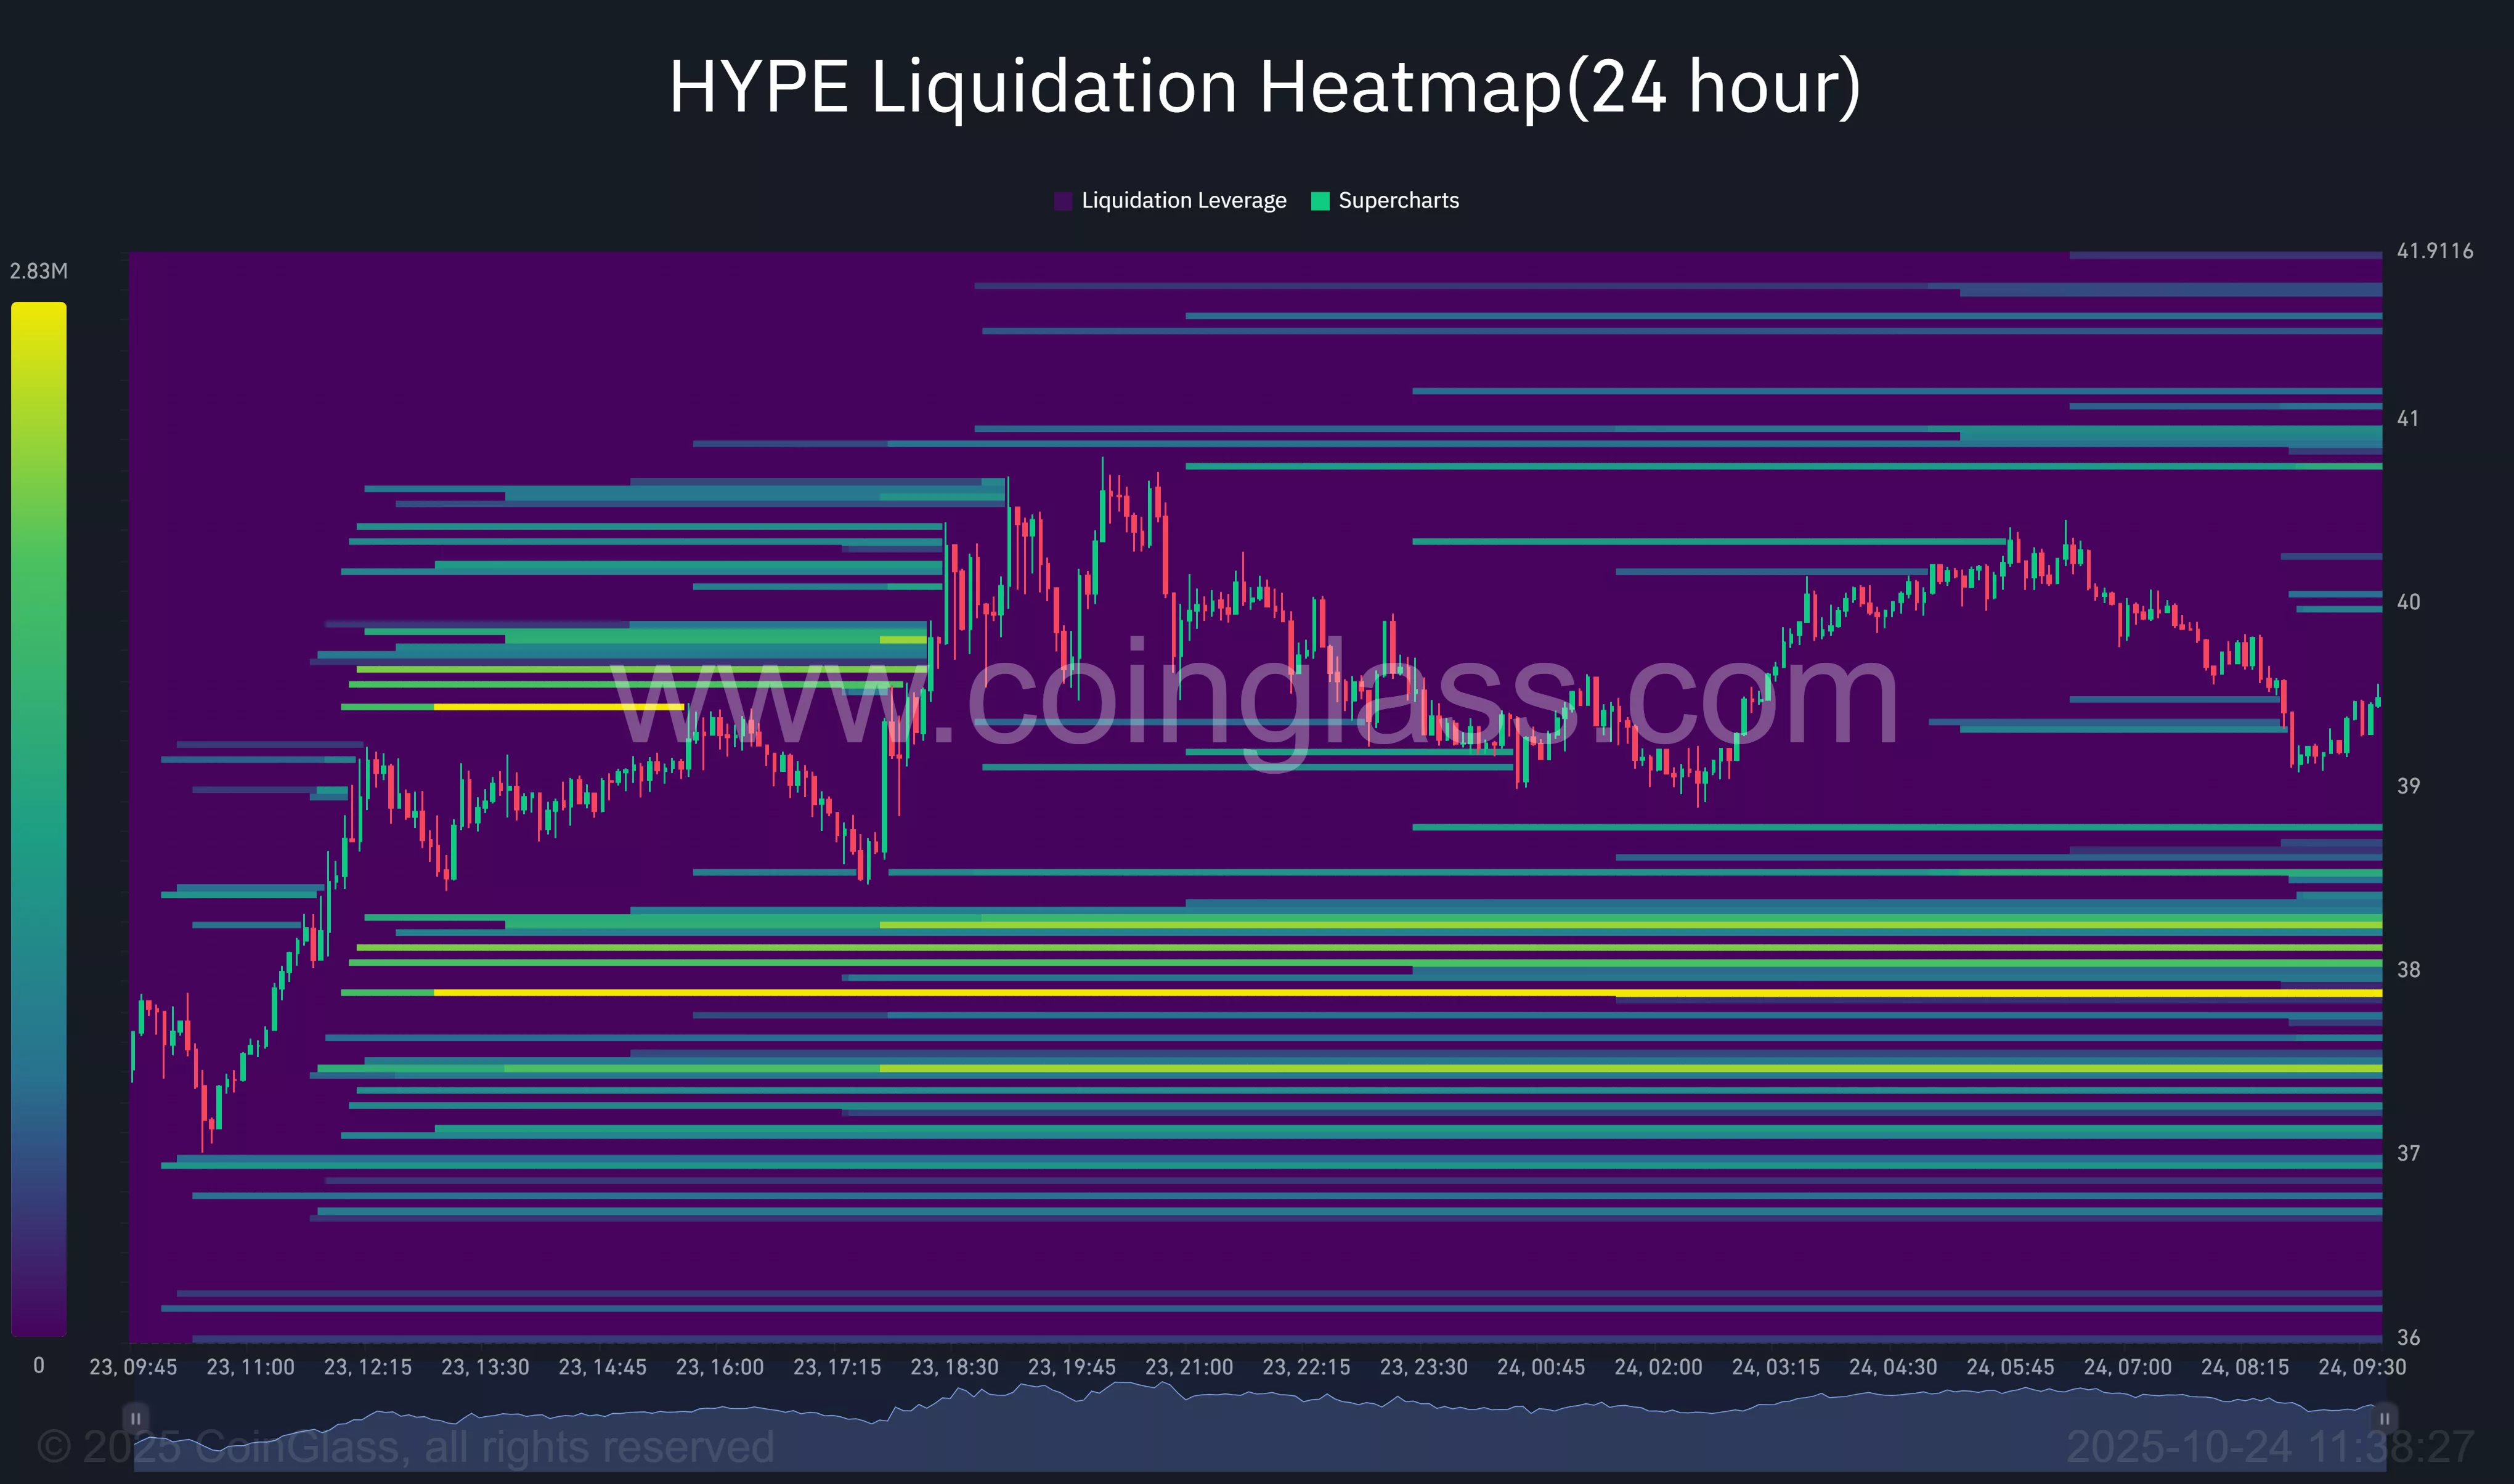
On the downside, there’s a lot of liquidation activity between $38 and $36, which could act as a short-term support zone. Buyers might try to defend this area to stop the price from falling further. But if HYPE drops below $36, there is less trading activity and support below, which could lead to more price swings and a faster drop.