

Pump.fun price prediction: Can PUMP break $0.006 and reach $0.0074?


Pump.fun price has recovered toward $0.00584 after an intraday drop to $0.005383 on Oct. 1, putting the $0.006 resistance level back in focus as traders watch whether PUMP can extend its late-September rally.
- Pump.fun price traded near $0.005839 after recovering roughly 8.5% from its daily low.
- Daily Aroon readings stood at 100% for the upward line and 0% for the downward line.
- Crypto With Gopal identified a bullish flag with a conditional target near $0.00740.
- CoinGlass showed a prominent liquidation cluster around $0.00587, just above the latest price.
TradingView’s Binance daily chart placed PUMP at $0.005839, down 1.45% from the session’s opening price of $0.005925. The token reached a daily high of $0.006097 before falling to $0.005383 and recovering much of that decline.
The daily high stood about 13.3% above the low, showing the size of the session’s price swings. By the chart’s latest reading, PUMP remained approximately 4.2% below that high, with buyers bringing the token back toward the area where its earlier advance stalled.
PUMP recovery brings $0.006 back into focus
The TradingView chart showed PUMP climbing from a mid-September base around $0.0035 to prices above $0.006 at the start of October. The advance followed an earlier August rally and a September correction, leaving the token near the upper end of its recent trading history.
At $0.005839, PUMP stood roughly 67% above the $0.0035 area. The latest daily decline therefore came after a substantial recovery, rather than a return to the lows that preceded the rally.
The immediate price test sits around $0.006, followed by the session high of $0.006097. PUMP briefly traded above the round-number level during the day but had moved back below it by the latest chart reading.
TradingView’s daily Supertrend remained green at $0.003960, well below the market price. PUMP traded approximately 47% above that indicator level, leaving a wide gap between the current consolidation and the daily Supertrend reference.
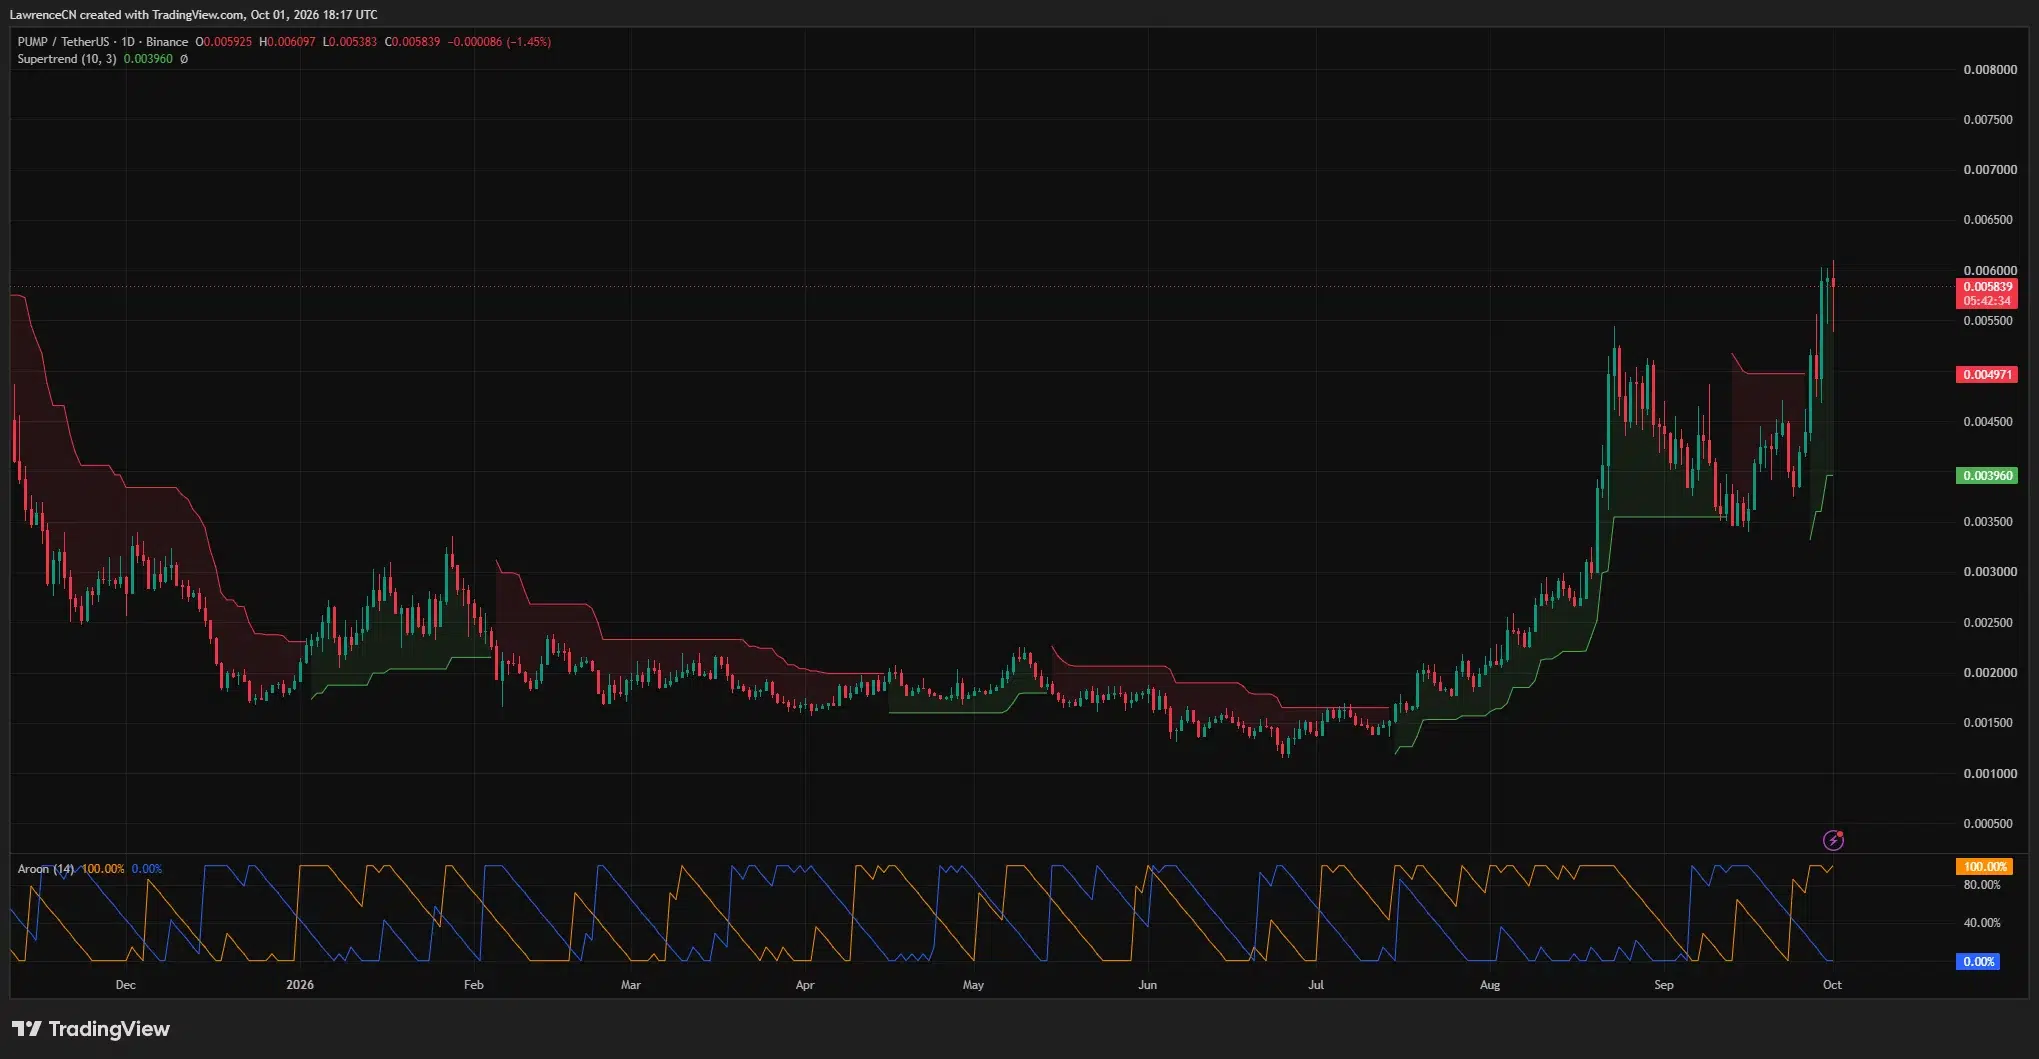
The daily Aroon indicator also retained upward readings. Aroon Up stood at 100%, while Aroon Down measured 0%, placing the most recent period high at the end of the indicator’s lookback window.
Together, the daily chart readings showed that PUMP’s pullback had occurred while its Supertrend and Aroon indicators remained aligned with the recent advance.
Analysts identify flag and cup-and-handle setups
Crypto With Gopal identified a possible bullish flag on PUMP’s 1-hour chart in an Oct. 1 post. The analyst placed the consolidation range between approximately $0.00545 and $0.00600, following the preceding upward move.
The analyst tied the continuation scenario to buyers reclaiming the upper boundary. A clean breakout above $0.00600, according to the post, could confirm the setup and put an upside target around $0.00740 in view.
That target sits roughly 26.7% above the daily chart’s $0.005839 reading. From the proposed $0.006 breakout level, the distance to $0.00740 is about 23.3%.
The lower end of the analyst’s flag range, around $0.00545, lies close to the session’s $0.005383 low. A move beneath that range would run against the consolidation structure described in the post and bring the day’s lowest price back into focus.
A separate Oct. 1 post from nordin.eth presented a longer-term cup-and-handle interpretation on the daily chart. The annotated chart showed a broad rounded base, a subsequent handle, and price moving above the marked neckline.
Nordin.eth made trading volume a condition for the next move, saying a breakout with volume would change the outlook. The two posts therefore used different timeframes, but both made further upside dependent on a confirmed price break.
Liquidation clusters surround the rebound
CoinGlass’s 24-hour liquidation heatmap showed PUMP falling from the $0.006 area toward $0.0054 before recovering toward $0.00584 late in the displayed period.
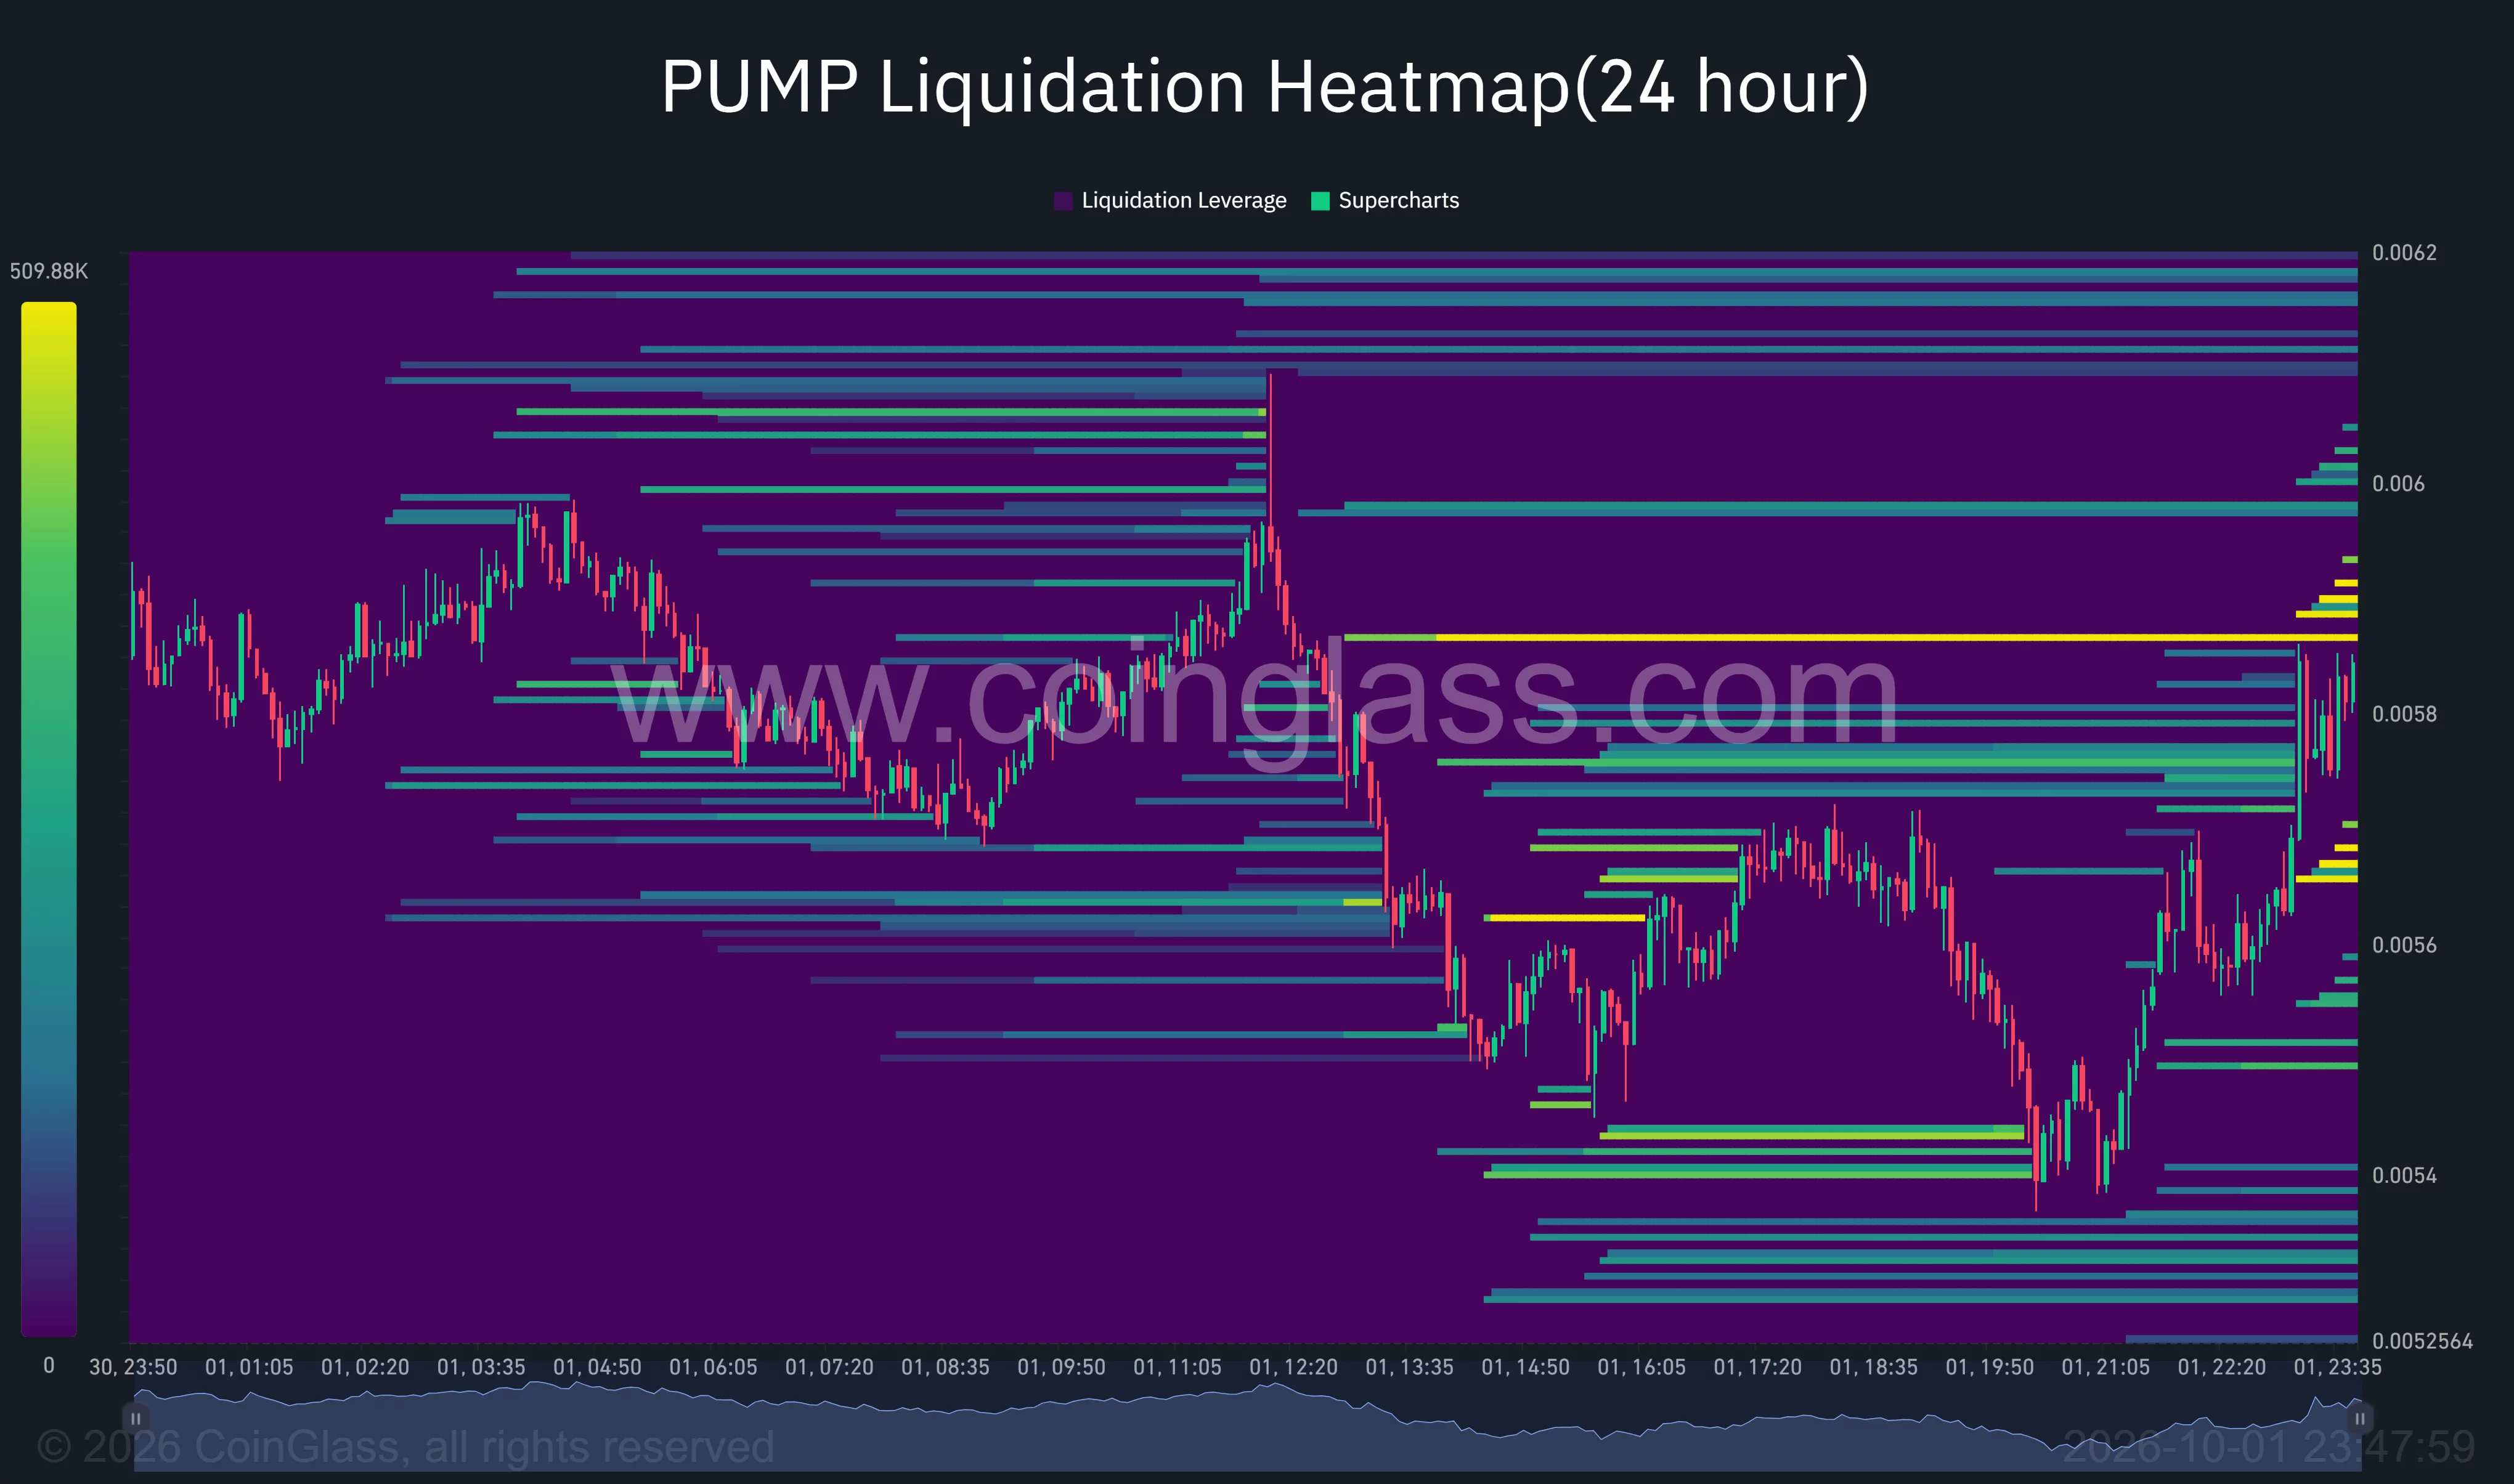
A prominent yellow band appeared around $0.00587, immediately above the latest price. Additional overhead bands sat around $0.0059 and across the $0.0060–$0.0062 region, overlapping the resistance area visible on the daily chart.
Below the market, the heatmap showed concentrations around $0.00565–$0.00570 and near $0.0054. Those areas corresponded with parts of the intraday decline and rebound.
The price recovery brought PUMP back toward the nearest overhead cluster without yet clearing the $0.006 level identified in the flag analysis. A renewed decline would first return attention to the lower heatmap bands before the session low.
CoinGlass’s chart also showed the market making more than one attempt to approach $0.006 during the displayed period. Each attempt was followed by a retreat, while the latest rebound remained below the earlier intraday peaks.
Buybacks continue as US rates remain higher
Strata Terminal’s on-chain tracker recorded approximately $23.1 million in PUMP buybacks over the preceding 30 days as of Oct. 1. Its dashboard placed cumulative purchases at about $469.2 million, providing a separate measure of the platform’s token purchases alongside the chart’s price recovery.
For US market context, the Federal Reserve raised its benchmark interest-rate range by 25 basis points to 3.75%–4.00% on Sep. 16. The decision passed unanimously, with the central bank citing elevated inflation and its goal of returning inflation to 2%.
PUMP’s next technical test remains closer to the market: the $0.006 boundary identified by Crypto With Gopal and the $0.006097 daily high. The analyst’s $0.00740 scenario depends on a breakout, while the lower flag boundary near $0.00545 and the daily low of $0.005383 define the immediate downside levels.
Disclosure: This article does not represent investment advice. The content and materials featured on this page are for educational purposes only.