Solana network usage hits all-time high; will SOL price reach $120?


Solana (SOL) price surged to a 30-day peak of $107 on Jan. 30 as rising defi volumes on the layer-1 network airdrop buoyed investor confidence.
Solana is trading at $98 at press time on Feb. 5, down 8% from the recent peak of $107 recorded just six days prior. But notably, a stark comparison between Solana’s price and the current trading volume trends suggests most SOL holders are positioned for an early rebound phase.
Solana outperformed the market to hit 30-day peak
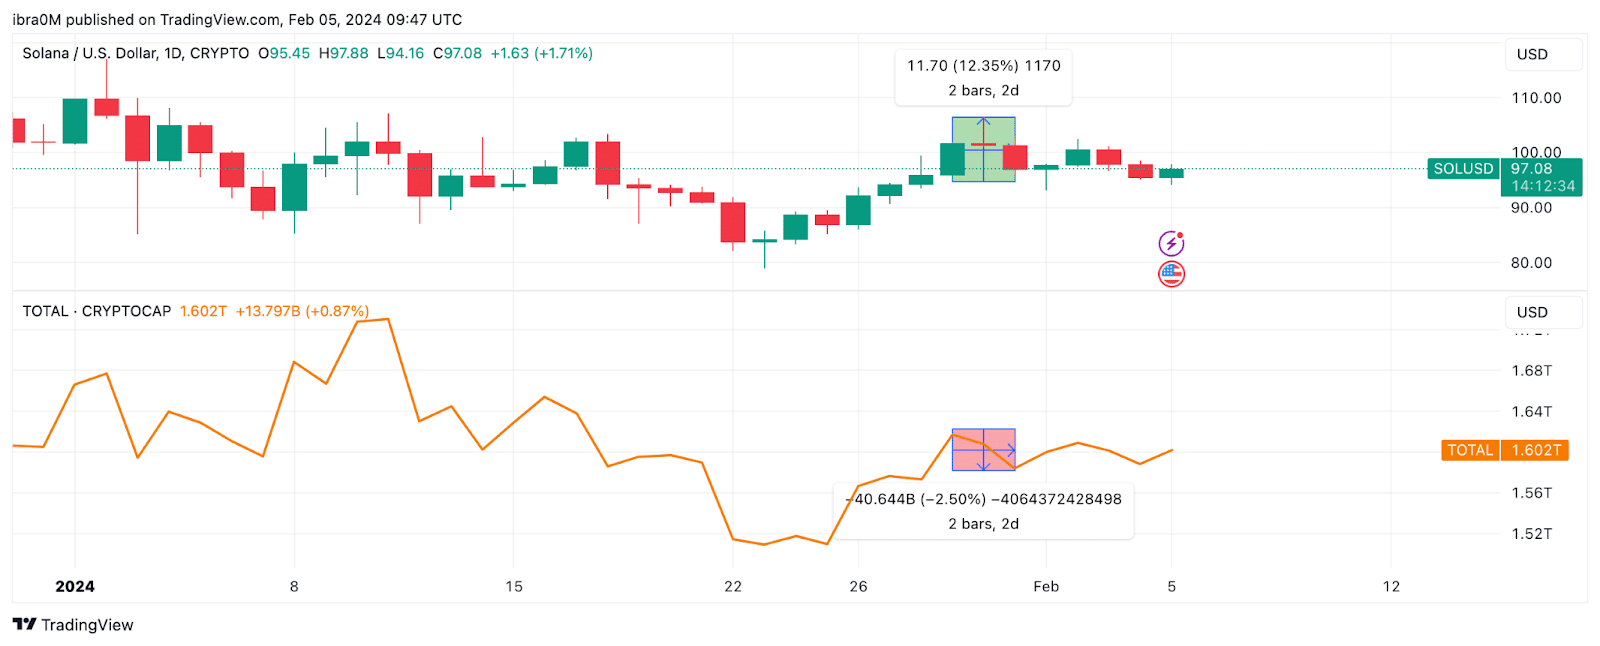
Solana price bucked market trends on Jan. 30, soaring 12.4% to a 30-day high of $107, while the rest of the crypto markets grappled with negative blowback from U.S. Federal Reserve Chief Jerome Powell statements hinting at postponing back rate cuts beyond March 2024.
The global crypto market capitalization dipped 2.5% shedding over $40 billion within 24 hours of Powell’s statements on Jan 31 as depicted in the chart below.
Meanwhile, increased demand across the defi ecosystem and positive speculations surrounding the upcoming Jupiter (JUP) airdrop had sent SOL prices into a rally.
However, since rejecting at $107 on Jan. 30, SOL price has now suffered an 8% pullback, exchanging hands at around $97 at press time on Feb. 5. But interestingly, key market data trends suggest majority of current SOL holders still maintain a bullish outlook amid the ongoing Solana price pullback.
Solana price consolidates as holders abstain from selling
The Santiment chart below shows that Solana’s trading volume peaked at $3.8 billion on Jan. 31 during last week’s rally. But notably, as prices began to dip, SOL holders have increasingly refrained from trading.
The latest reading shows that Solana trading volume has now reduced by $2.4 billion compared to last week’s peak, with only $1.4 billion worth of trades involving SOL recorded on Feb. 4.
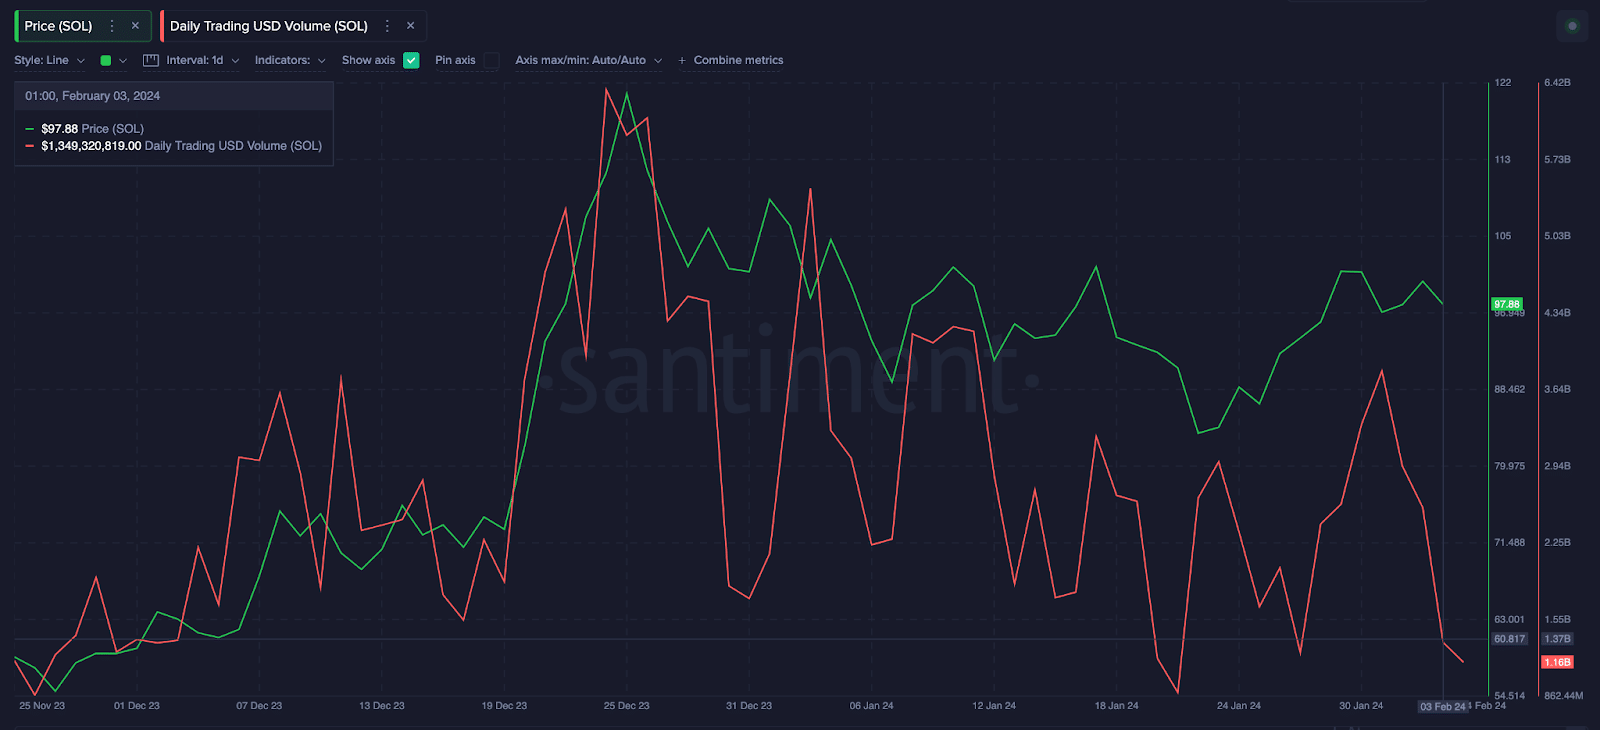
Effectively, Solana holders have now cut their trading activity by 56% between Jan. 31 and Feb. 5, while Solana price has only declined by 8% during that period.
When trading volume declines significantly faster than price downtrend, as observed above, it signals a dominant positive conviction among the current holders.
Essentially, this decline in trading volume suggests that existing holders are not rushing to sell or close out their positions, hence the resilient SOL price performance.
Solana network usage is at all-time highs
In addition to the curtailed selling pressure, critical fundamental factors, such as rising demand from increased defi activity and the positive speculation surrounding the Jupiter project, have further beefed up support for SOL price in the past week.
According to Token Terminal data, Solana recorded over 875,000 active users on Jan. 31, the highest recorded on the layer-1 network since its inception in 2020.
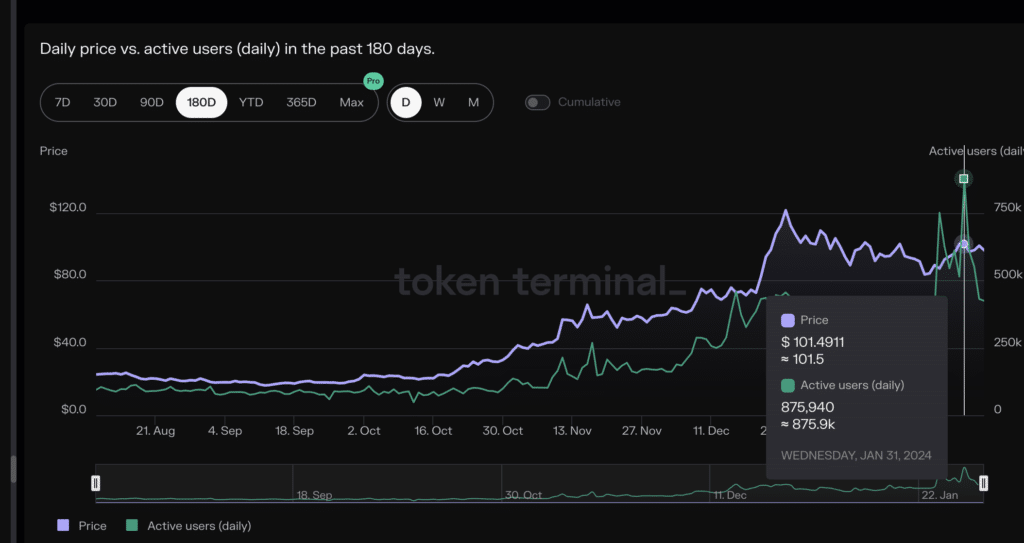
Solana has since maintained a five-day average of 578,000 active users, more than 26% higher than the 2023 peak of 458,210 users.
The Jan. 31 surge was not an outlier event but a signal of organic growth and increased adoption of projects built on the Solana Layer-1 network.
Solana price forecast: $120 retest in focus
The network growth and the curtailed selling pressure both put Solana in a prime position for another leg-up toward the $120 area in the days ahead.
Furthermore, current trends observed on the Parabolic SAR technical indicator also supports this bullish SOL price forecast.
When the Parabolic SAR points below an asset’s current price, it indicates an imminent reversal of the ongoing downtrend. In this case, the blue dots representing Parabolic SAR currently point to $87, while the current Solana price is $0.98, confirming the positive forecast.
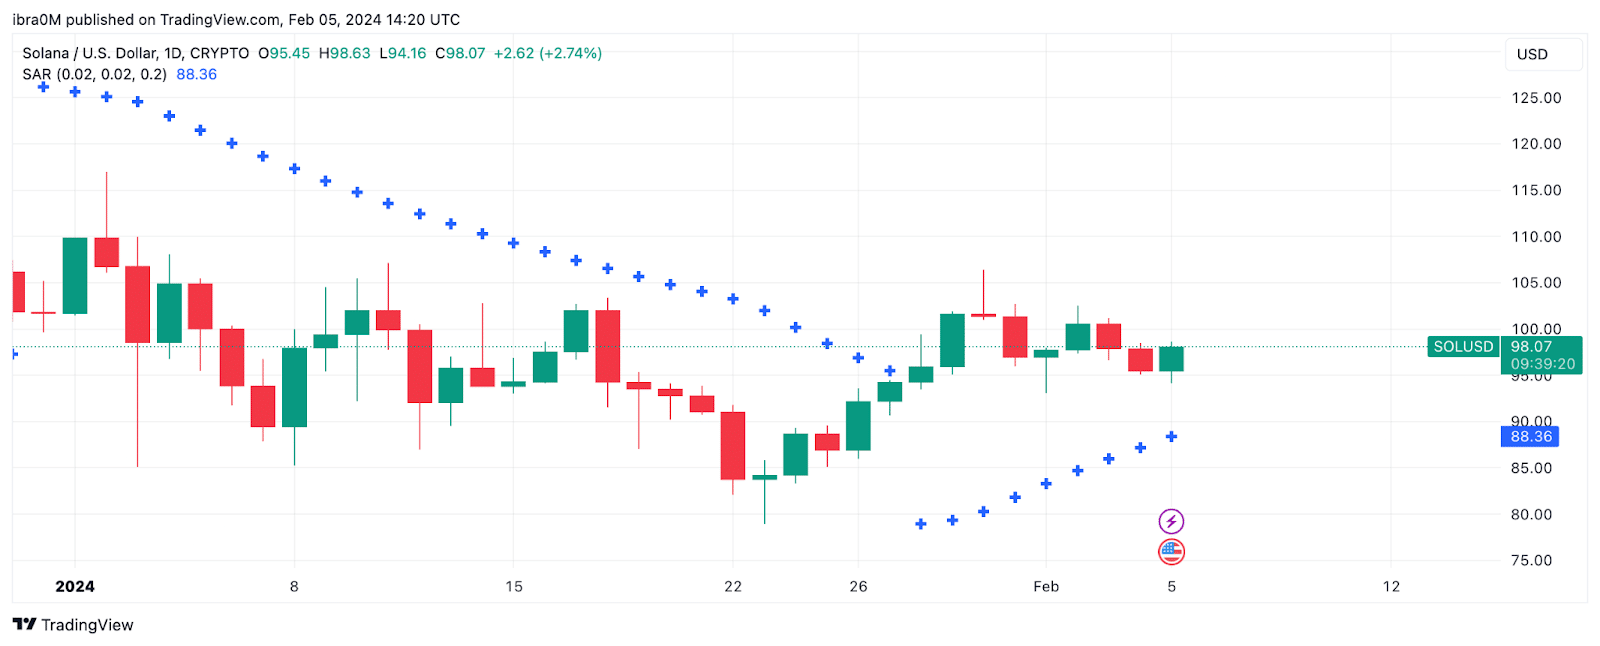
Traders often interpret this situation as a signal to hold or buy more, as it implies that the price trend might be on the verge of a bullish reversal.
If this scenario plays out as predicted, the bulls can stage a decisive breakout towards the $120 territory.
Conversely, the bears could negate this bullish forecast by forcing a correction below the $85 area. However, as outlined by the SAR dots above, the support buy wall at $87 could form a daunting challenge.