Ethereum price clears key averages in push toward $2,000


Ethereum price traded near $1,918 on Friday after reclaiming $1,900, as spot ETF inflows and improving short-term momentum supported another test of overhead resistance.
- Ethereum price held above $1,900, turning the psychological threshold into near-term support.
- US spot Ethereum ETFs attracted $92.15 million in net inflows on Aug. 6.
- The 4-hour RSI rose to 61.74, showing bullish momentum without reaching overbought territory.
- Liquidity clusters near $1,925 and $1,950 could draw price higher, while $1,850 remains key support.
Ethereum price action today
According to data from crypto.news, Ethereum (ETH) price traded at $1,918.26 at the time of writing, up 0.74% during the daily session. The token reached an intraday high of $1,918.88 after opening near $1,904.
The move extended ETH’s recovery from the $1,850 area and kept its weekly gain above 4%. Buyers have repeatedly defended the $1,840–$1,850 region since the start of August, preventing a deeper correction toward the July lows.
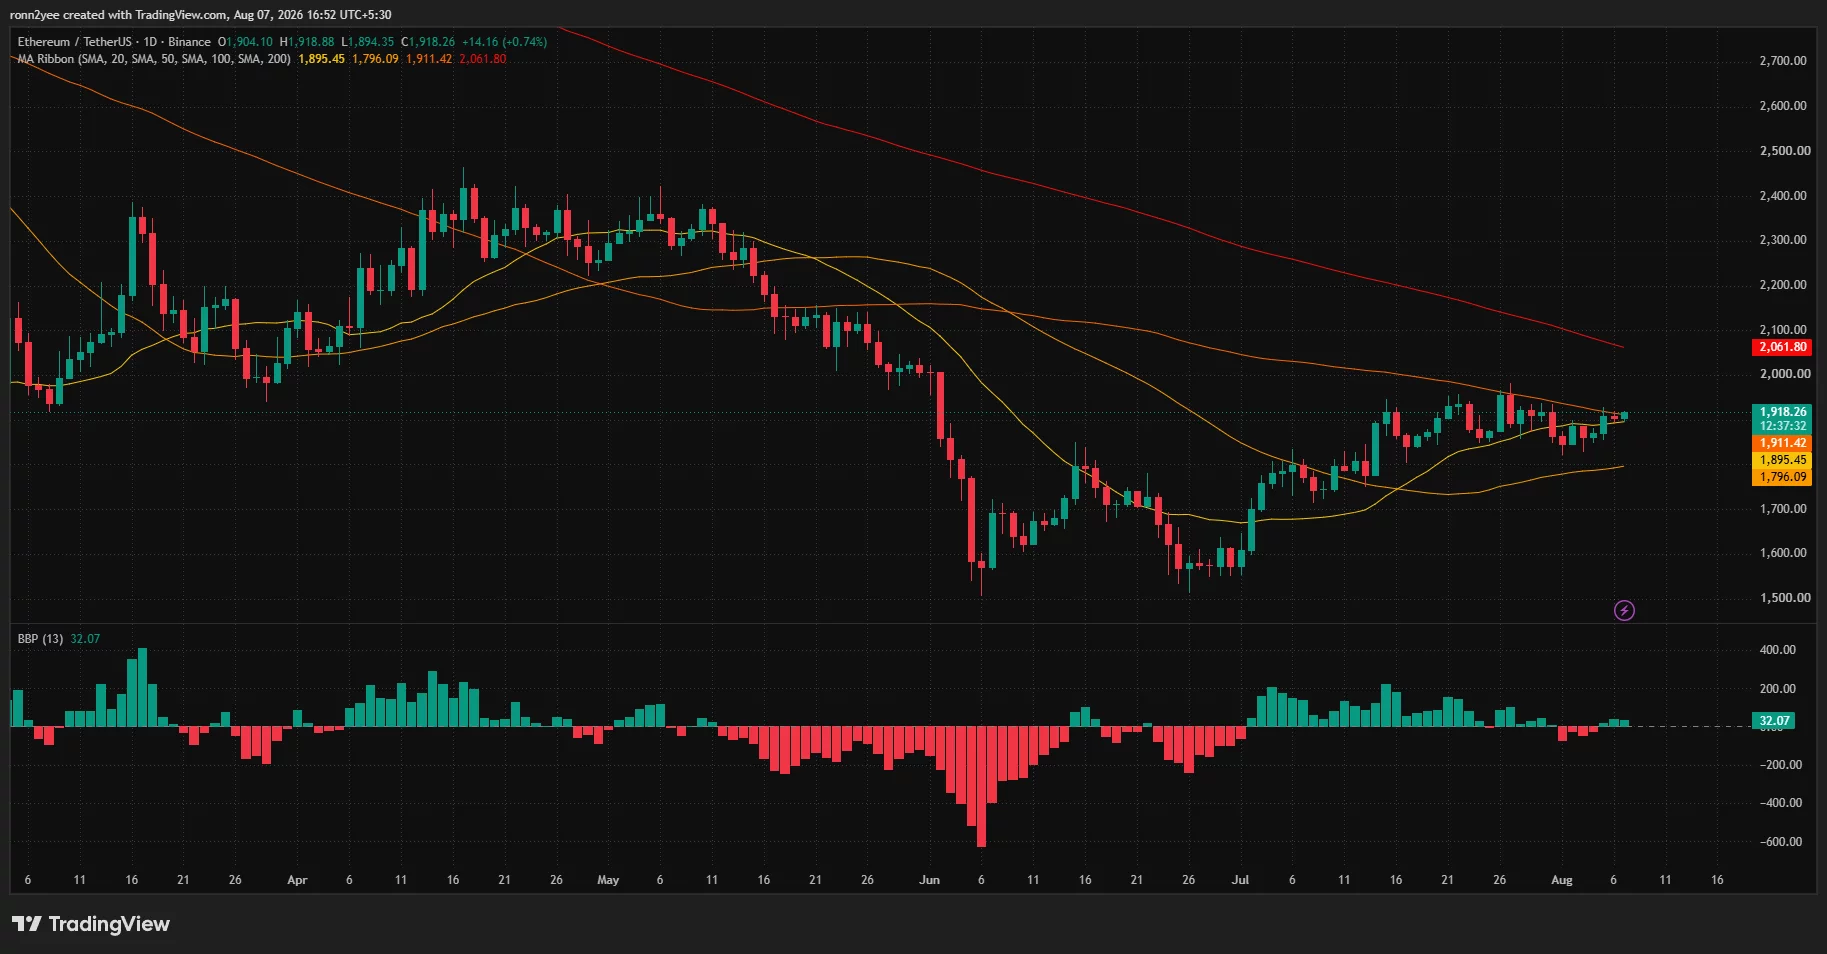
Price has now moved above three closely watched daily averages. ETH is trading over its 20-day moving average at $1,895.45, its 100-day average at $1,911.42, and its 50-day average at $1,796.09.
That alignment improves the short-term outlook, but Ethereum remains below its 200-day moving average at $2,061.80. The gap shows that the latest recovery has not yet reversed the broader downtrend that began after ETH traded above $2,400 in April.
The daily Bull Bear Power reading has returned to positive territory at 32.07. The indicator suggests buyers have regained a modest advantage after bearish pressure briefly returned at the beginning of August.
ETF inflows and US jobs data support ETH
Renewed demand for US-listed spot Ethereum exchange-traded funds has provided one catalyst for the move.
The funds recorded about $92.15 million in net inflows on Aug. 6, equal to roughly 48,327 ETH at the reported market price. The latest intake followed net inflows of $60.86 million on Aug. 5, with BlackRock’s ETHA accounting for $50.34 million of that session’s total.
Cumulative net inflows into US spot Ethereum ETFs have now moved above $11.4 billion. The products give US investors regulated ETH exposure through conventional brokerage accounts, although their flows do not always produce an immediate or proportional price response.
A softer US employment reading also helped the wider risk-asset backdrop. Private employers added 44,000 jobs in July, below forecasts of about 70,000 and down from a revised 95,000 in June, according to ADP.
The weaker hiring figure pointed to some cooling in the labor market. However, annual pay still rose 4.4%, and jobless claims remained historically low, leaving uncertainty around the Federal Reserve’s next rate decision. Any renewed increase in rate-hike expectations could weigh on ETH and other risk assets.
Ethereum liquidation map points to $1,950
Ethereum’s 4-hour chart shows price moving above the Supertrend threshold near $1,907.42. Holding that level would preserve the immediate bullish structure and give buyers another opportunity to attack the recent highs.
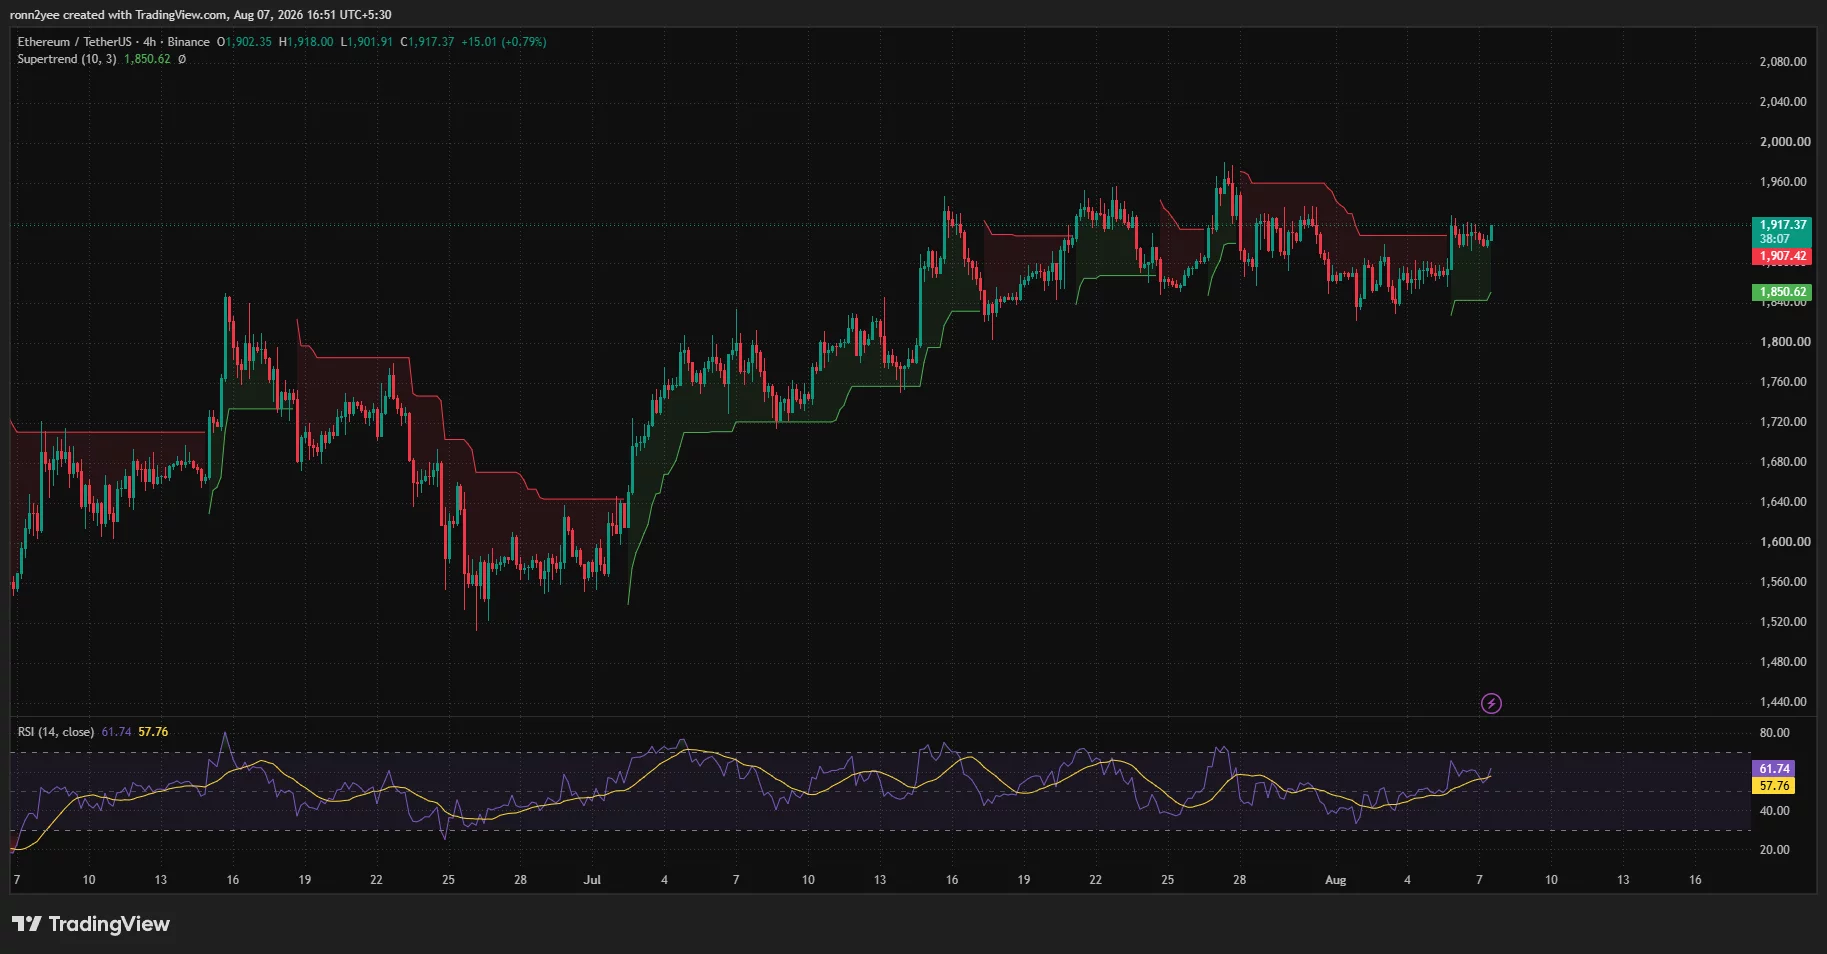
The 4-hour Relative Strength Index stood at 61.74, above its signal average of 57.76. Momentum therefore favors buyers, but the reading remains below the overbought threshold of 70.
The 3-day liquidation heatmap shows a concentration of leveraged positions immediately above the market near $1,925. A larger liquidity band sits around $1,945–$1,955.
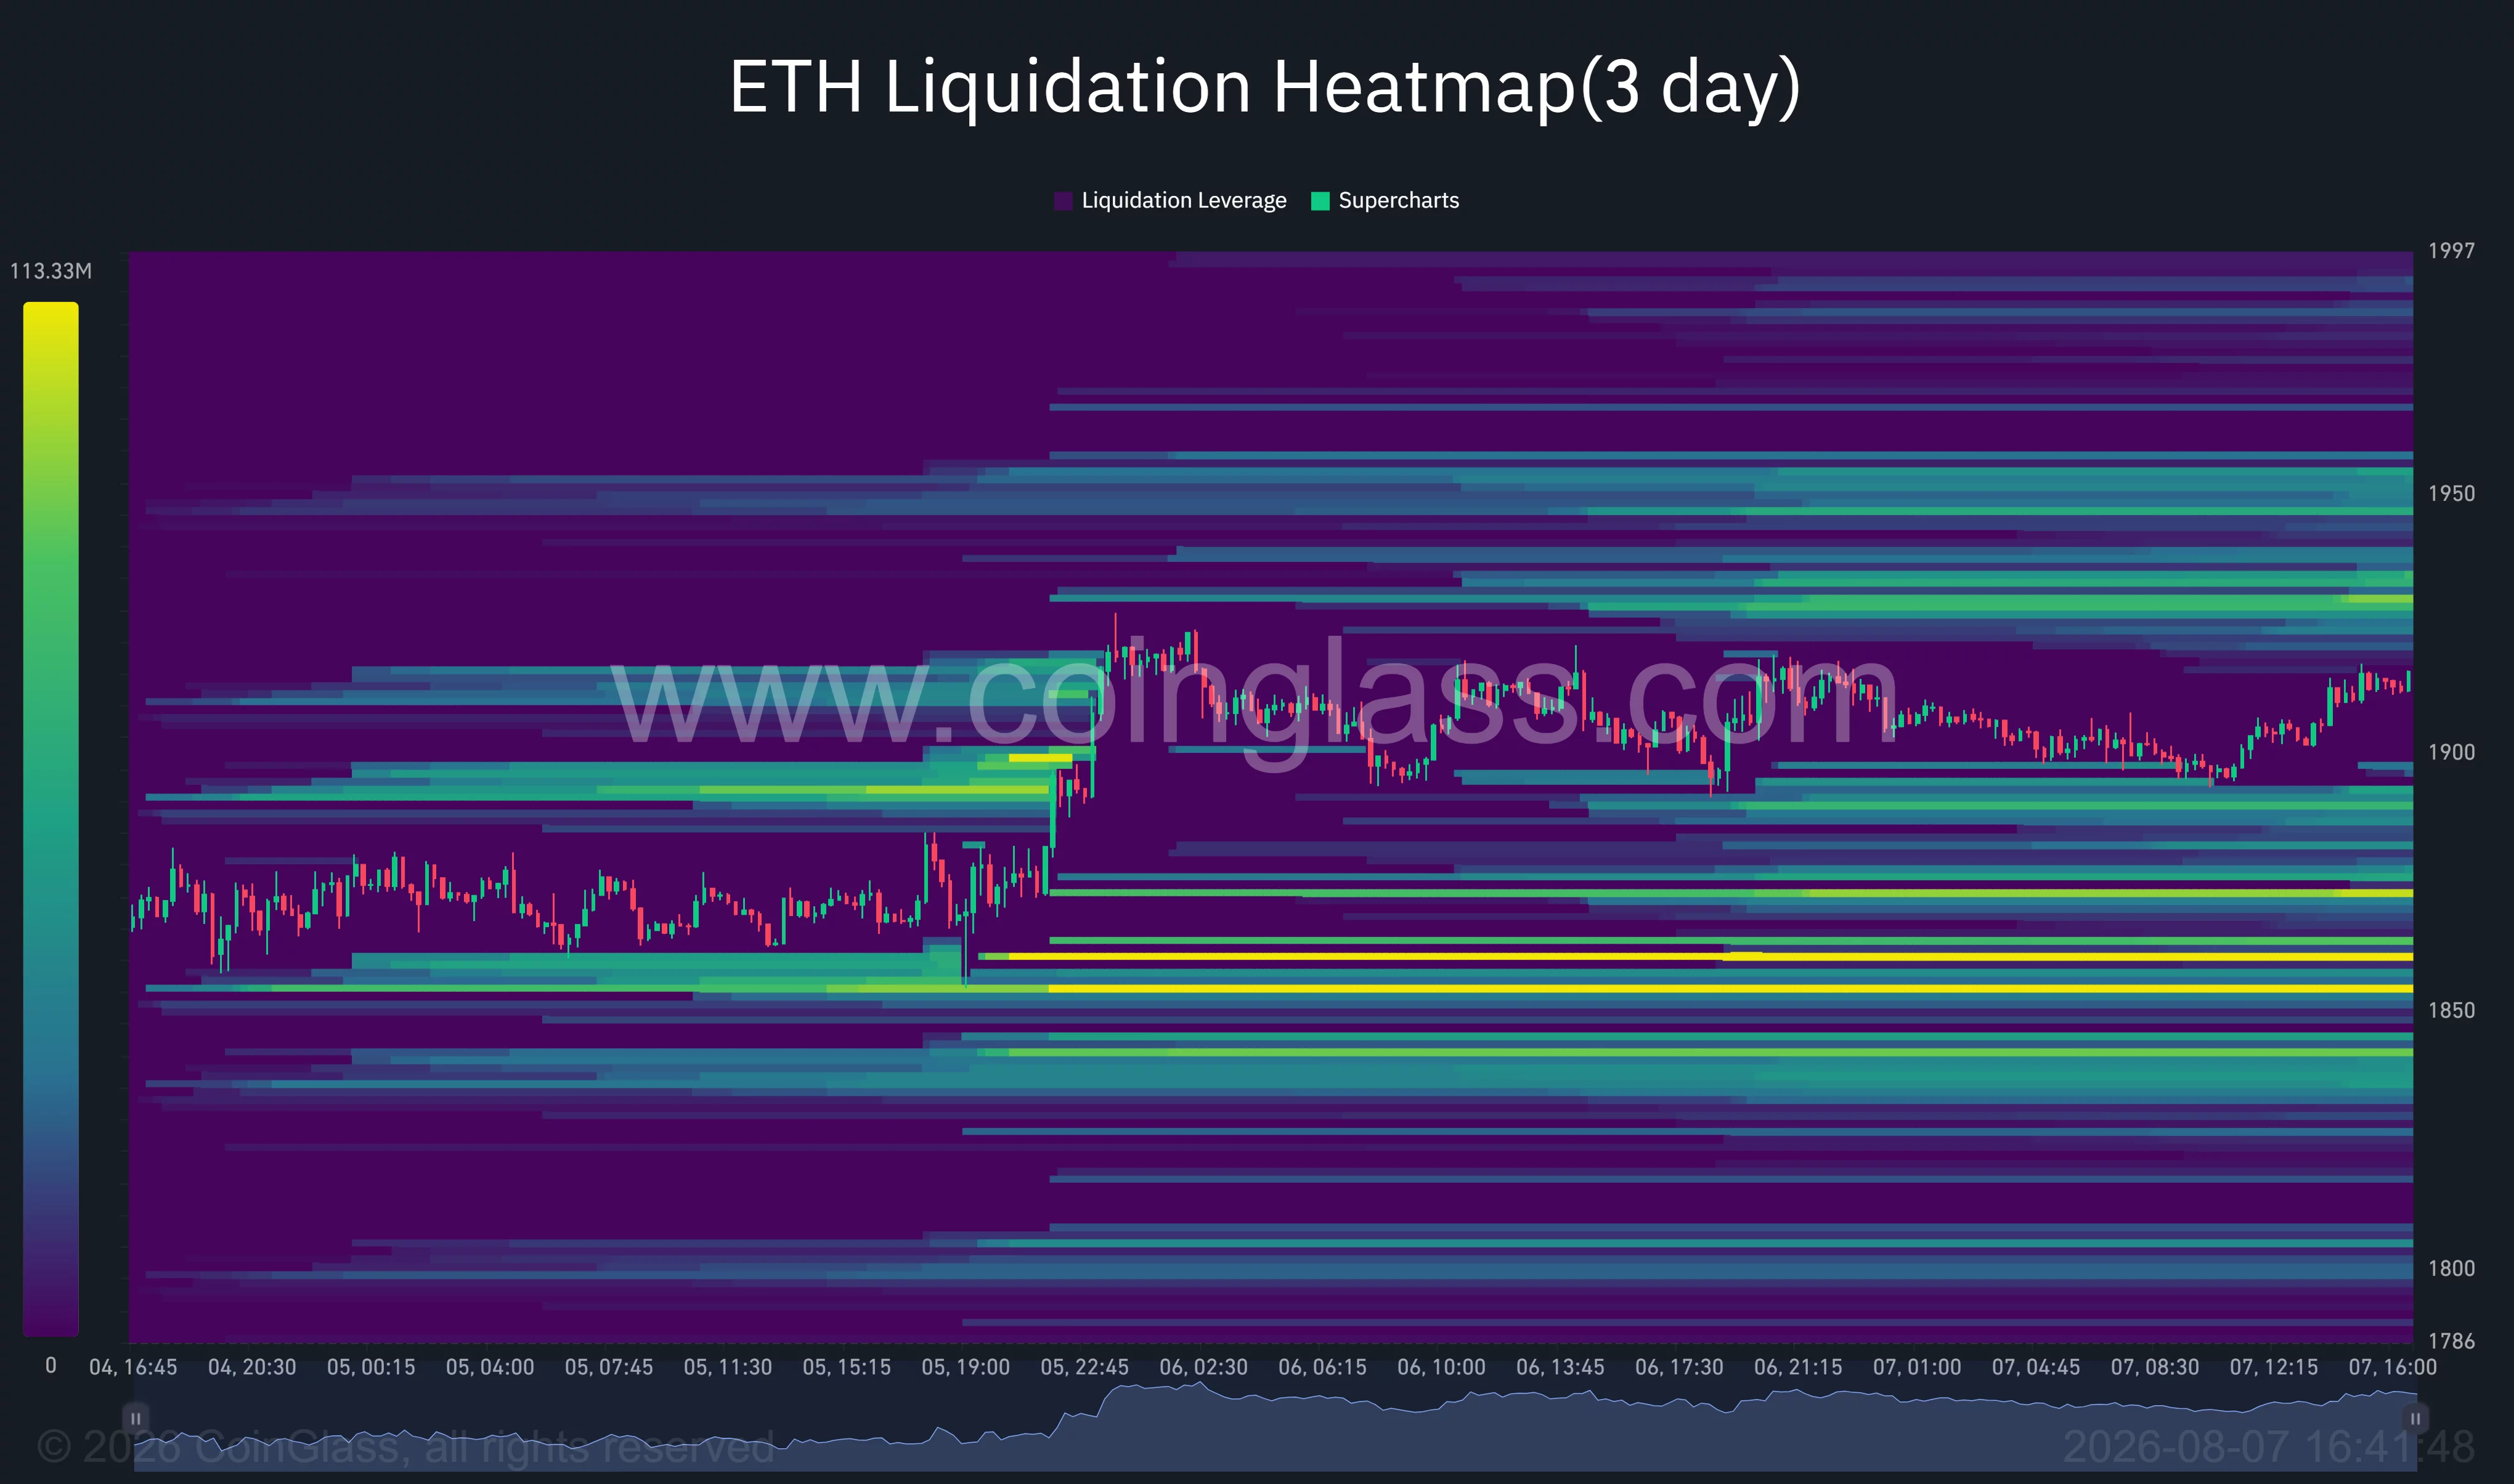
These pools could act as short-term price magnets. A push through $1,925 may trigger forced buying from short sellers and accelerate a move toward $1,950.
Above that level, the psychological $2,000 mark becomes the next target. Ethereum would still need to overcome the daily 200-day average near $2,062 before the broader technical structure turns decisively bullish.
Liquidity is also building below the current price. The nearest downside zones appear around $1,890, $1,870 and $1,850–$1,860. Losing $1,900 could therefore expose ETH to a sweep of leveraged long positions in those areas.
The 4-hour Supertrend support near $1,850.62 provides the main bullish invalidation level. A sustained break below it would weaken the recovery and could open a move toward $1,800 or the 50-day average near $1,796.
Analysts see $2,000 as the next Ethereum test
Analyst Michaël van de Poppe said Ethereum could outperform Bitcoin if the broader market leader begins another upward move.
“Honestly, if BTC breaks upwards, I’d assume we’re seeing a significantly stronger breakout on ETH rather than Bitcoin.”
His chart placed a broader Ethereum target near $2,400, although ETH would first need to clear resistance around $2,000 and the 200-day moving average.
Analyst Ted Pillows also focused on the reclaimed psychological level and the potential for a short-term continuation.
“ETH is still holding above the $1,900 level. Clarity Act voting has been delayed, but still Ethereum looks good. If ETH manages to hold above this level, a rally to $2,000 could happen next.”
For now, $1,900 separates the bullish and bearish short-term scenarios. A daily close above $1,925 would strengthen the case for $1,950 and $2,000, while a reversal below $1,900 would shift attention back to $1,850.
Disclosure: This article does not represent investment advice. The content and materials featured on this page are for educational purposes only.