Uniswap price surges 25% as Standard Chartered’s $100 UNI call sparks breakout


Uniswap has surged more than 25% on Wednesday after Standard Chartered initiated coverage of UNI with a $100 price target for 2030, triggering one of the strongest rallies among large-cap cryptocurrencies this week.
- UNI jumped over 25% in a day and nearly 50% in a week after Standard Chartered initiated coverage with a $100 price target for 2030.
- The rally followed a breakout from a multi-week falling channel, with momentum indicators and key Fibonacci levels turning bullish.
- Growing interest in tokenized equities, improving risk sentiment, and heavy short covering helped fuel the advance.
According to data from crypto.news, Uniswap (UNI) climbed to an intraday high of $3.70 on June 17 before stabilizing around $3.64 at press time. The move extended the token’s weekly gain to nearly 50%, making it the top-performing asset among the 100 largest cryptocurrencies over both the daily and weekly timeframes.
The rally began shortly after Standard Chartered’s digital assets team launched research coverage on UNI. In a note dated June 15, the bank argued that Uniswap is positioned to become a key piece of infrastructure for tokenized finance as traditional assets move on-chain.
According to Standard Chartered Head of Digital Assets Research Geoffrey Kendrick, tokenized assets active in decentralized finance could expand dramatically over the remainder of the decade.
“We initiate coverage of Uniswap with a UNI-USD price forecast of USD 100 by end-2030, a 40x increase from today’s USD 2.50 level. This would see UNI outperform both ETH and BTC by end-2030.”
The report arrived as investors increasingly focused on tokenized equities and real-world assets. Uniswap recently expanded access to tokenized shares through its platform, allowing users to trade representations of companies such as SpaceX, Apple, Nvidia, and Tesla directly through decentralized infrastructure.
At the same time, macro conditions turned favorable for risk assets. Bitcoin remained largely range-bound near $65,000 ahead of the Federal Reserve’s latest policy decision, while easing tensions surrounding a proposed U.S.-Iran agreement helped push oil prices lower and improved sentiment across speculative markets. The combination encouraged capital rotation into higher-beta altcoins, with UNI emerging as one of the primary beneficiaries.
Technical breakout opens path toward $4.20 resistance
The technical picture strengthened considerably after UNI broke out of a multi-week falling channel visible on the four-hour chart. Uniswap price pierced both the upper trendline and a descending resistance structure that had capped rallies since early May.
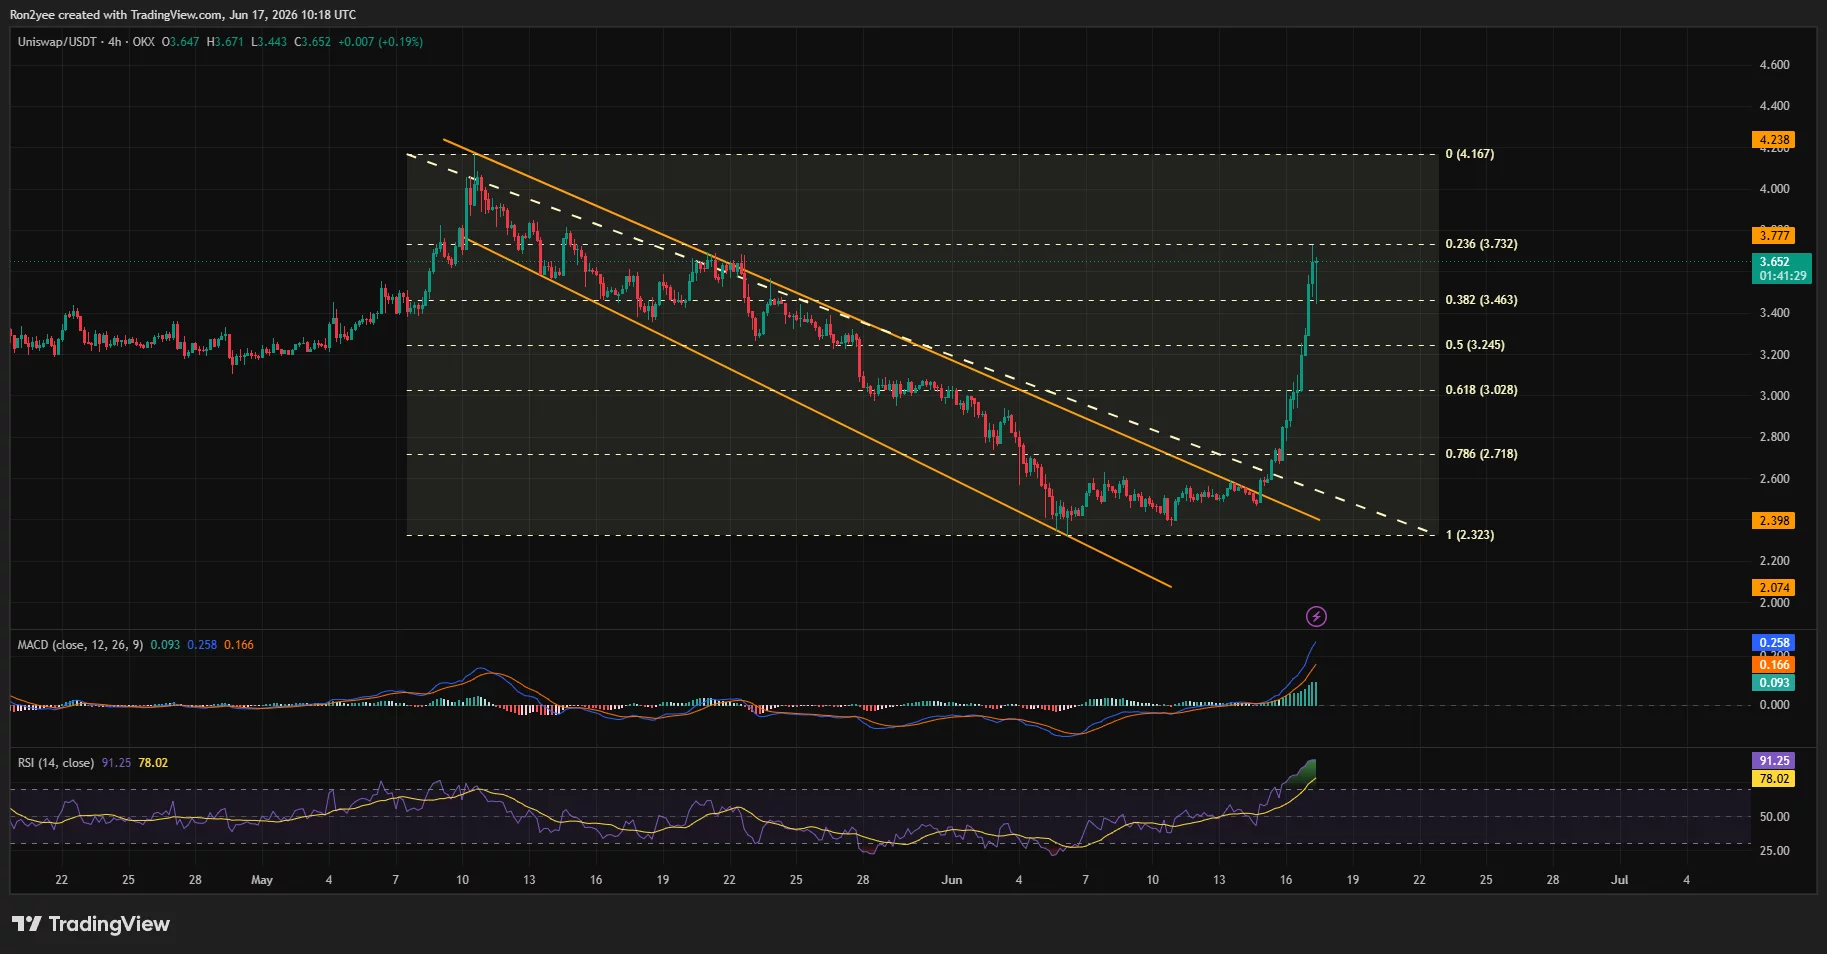
The breakout carried UNI from a June low near $2.32 to above $3.70, reclaiming several key Fibonacci retracement levels in rapid succession. The token has already cleared the 78.6% retracement level around $2.72, the 61.8% level near $3.03, the midpoint level at $3.24, and the 38.2% retracement near $3.46.
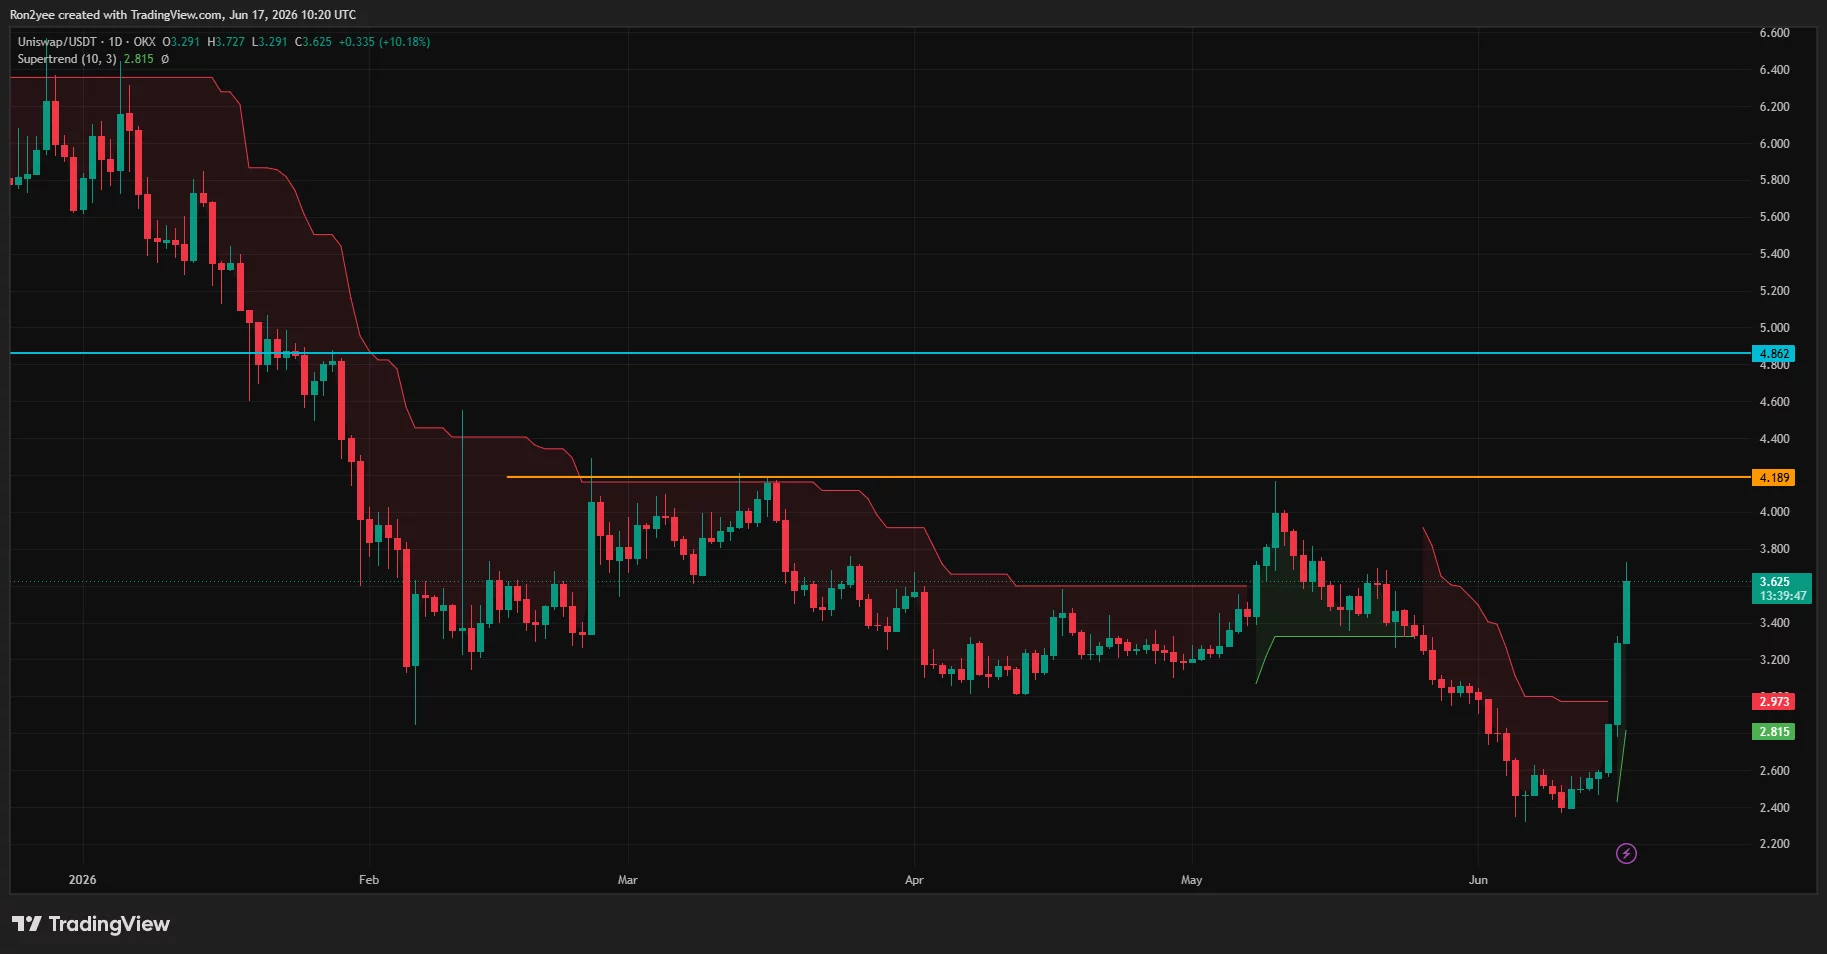
The next major resistance sits around $3.73, which corresponds to the 23.6% Fibonacci retracement. A decisive move above that level could expose the broader resistance zone between $4.17 and $4.24, an area that aligns with previous swing highs and a major horizontal barrier on the daily chart.
Momentum indicators remain firmly bullish. The four-hour RSI has climbed above 91, placing UNI in deeply overbought territory, while the MACD histogram continues to expand after a strong bullish crossover. Daily Supertrend data also shows the indicator flipping back into buy mode near $2.81 after spending months in bearish territory.
Overheated momentum raises pullback risk
Derivatives activity has accelerated alongside the rally. Futures trading volume increased by more than 240% as short sellers rushed to cover positions following the breakout. Elevated leverage and aggressive momentum buying helped fuel UNI’s vertical advance but also increased the risk of volatility.
The strongest support zone now sits between $3.46 and $3.24, corresponding to the 0.382 and 0.50 Fibonacci levels. A deeper retracement could bring the $3.03 area into focus, while a drop below the former channel breakout zone near $2.70 would weaken the current bullish structure.
Macro risks remain tied to the Federal Reserve’s policy outlook and geopolitical developments in the Middle East. Any resurgence in oil prices, deterioration in U.S.-Iran negotiations, or a more hawkish-than-expected message from Fed officials could pressure speculative assets and reduce appetite for high-volatility altcoins such as UNI.
Disclosure: This article does not represent investment advice. The content and materials featured on this page are for educational purposes only.