


Ethereum price eyes $2,800 as analysts await range breakout


Ethereum price has held near $2,718 on Oct. 6 as positive short-term money flow and bullish analyst views face a five-session withdrawal streak from US spot Ether ETFs. ETH remains above nearby technical support, but its recent trading range leaves buyers facing resistance before a move toward $2,800.
- ET traded near $2,718, above its daily moving average and 4-hour Supertrend support.
- US spot Ether ETFs lost a combined $206 million across five consecutive trading sessions.
- Michaël van de Poppe expects a breakout after Ethereum’s extended period of sideways trading.
- CoinGlass shows major liquidation clusters near $2,780–$2,790 overhead and $2,630–$2,650 below price.
TradingView’s Binance ETH/USDT daily chart showed Ethereum at $2,717.95, up 0.29% for the session, with a high of $2,725.13 and a low of $2,690.40. The 4-hour chart recorded a similar price of $2,718.45 as ETH continued trading below the late-September peak near $2,800.
The daily chart shows a sharp August advance from below $2,000, followed by another September push toward $2,800. Recent candles have clustered around $2,700, leaving Ethereum above its earlier summer range while the latest advance pauses below resistance.
Ethereum holds above $2,679 as daily momentum cools
On TradingView’s daily chart, the Bollinger Bands place the 20-day simple moving average at $2,679.31. Ethereum trades roughly 1.4% above that level, making the average the first nearby daily reference for a pullback.
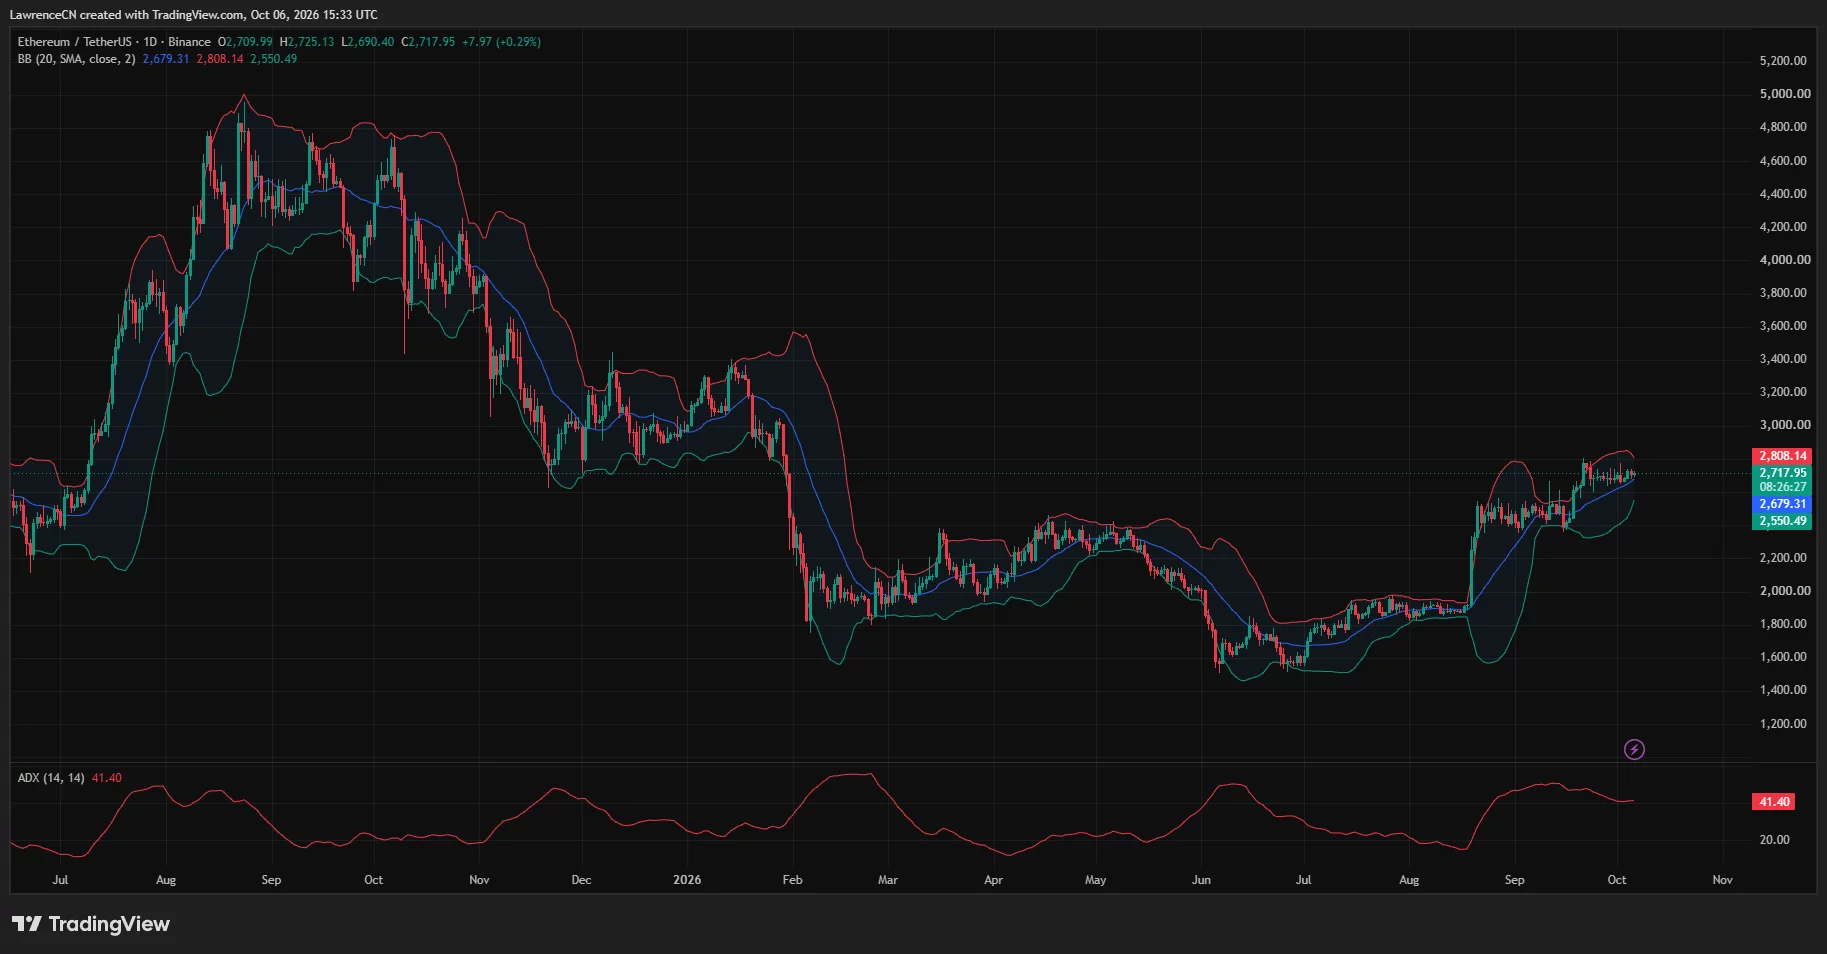
The upper Bollinger Band stands at $2,808.14, around 3.3% above the recorded price. That level sits close to the September peak, creating a narrow area around $2,800 where both the recent price high and the volatility indicator converge.
The lower band sits at $2,550.49, about 6.2% below ETH. A move toward that boundary would take Ethereum beneath both its daily average and the nearest downside liquidation clusters visible on CoinGlass.
TradingView’s daily average directional index reads 41.40, following higher readings during the September advance. The indicator measures trend strength rather than direction, while its recent decline accompanies the tighter sideways price movement.
The daily setup therefore retains price above the moving average, with the upper band still overhead. A sustained move beyond the recent peak and $2,808 band would extend the September recovery; a loss of $2,679 would shift the immediate focus toward the lower support levels.
Positive 4-hour money flow meets $2,738 resistance
TradingView’s 4-hour chart places the active green Supertrend line at $2,659.83, roughly 2.2% below Ethereum’s price. ETH has stayed above that line since the latest recovery from the early-October pullback.
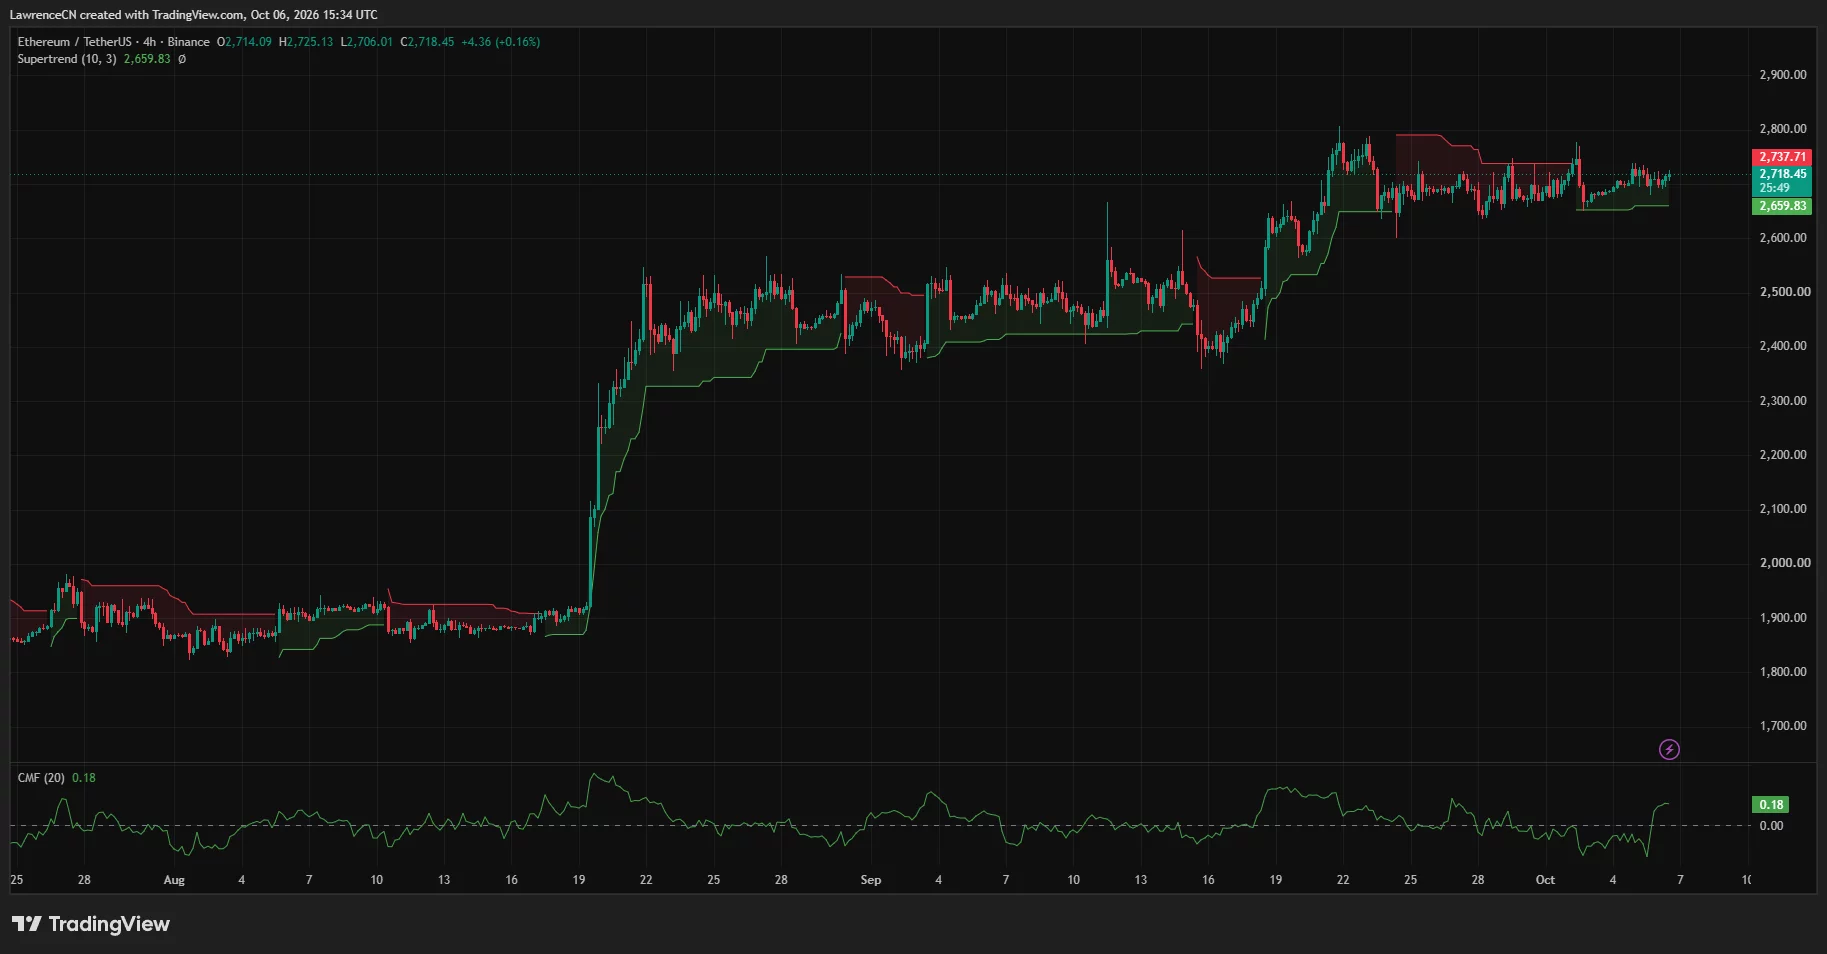
The same chart retains a previous red Supertrend level at $2,737.71. Recent candles remain below that area, giving traders an intermediate reference before the larger $2,780–$2,800 zone.
The 4-hour Chaikin Money Flow indicator reads 0.18 after recovering from negative territory. A positive reading reflects a positive balance of volume-weighted buying pressure over the indicator’s measurement period.
That improvement accompanies Ethereum’s rebound from the latest dip, while the price remains inside its recent range. Clearing $2,738 would place ETH closer to the September highs; losing $2,660 would take price below the active Supertrend support.
Analysts anticipate a breakout after weeks of sideways trading
Crypto analyst Michaël van de Poppe said in an Oct. 6 X post that Ethereum’s lengthy consolidation could precede a larger move.
“It’s just a matter of time before we’ll be seeing a big breakout taking place.”
His chart marks a sideways structure beneath the recent highs, with lower support around the mid-$2,600s. Van de Poppe’s expectation centers on a breakout from that structure rather than a confirmed move already underway.
Analyst Altcoin Sherpa also described Ethereum as strong but said it had remained in a tight 5% range for weeks. He expects that trading pattern to persist until Bitcoin makes a substantial upward move, tying his ETH outlook to a further advance in the broader market.
Altcoin Sherpa disclosed call options on ETHA, BlackRock’s iShares Ethereum Trust ETF. BlackRock states that the US-listed fund seeks to reflect Ether’s price performance, providing the US market connection to his disclosed position.
ETF withdrawals contrast with liquidity above $2,780
Farside Investors recorded $50.8 million in net withdrawals from US spot Ether ETFs on Oct. 5. BlackRock’s ETHA lost $31.9 million, while Fidelity’s FETH lost $18.9 million.
The latest withdrawal followed outflows of $2.8 million on Sep. 29, $59.6 million on Sep. 30, $55.4 million on Oct. 1 and $37.4 million on Oct. 2. Together, the five sessions removed $206 million, reversing the direction of the preceding week’s $689.8 million net inflow.
CoinGlass’s one-week liquidation heatmap shows a prominent overhead cluster around $2,780–$2,790, with additional bands near $2,750–$2,760. Below price, the brightest concentrations sit around $2,645 and $2,630, placing substantial leveraged-position exposure beneath the 4-hour Supertrend.
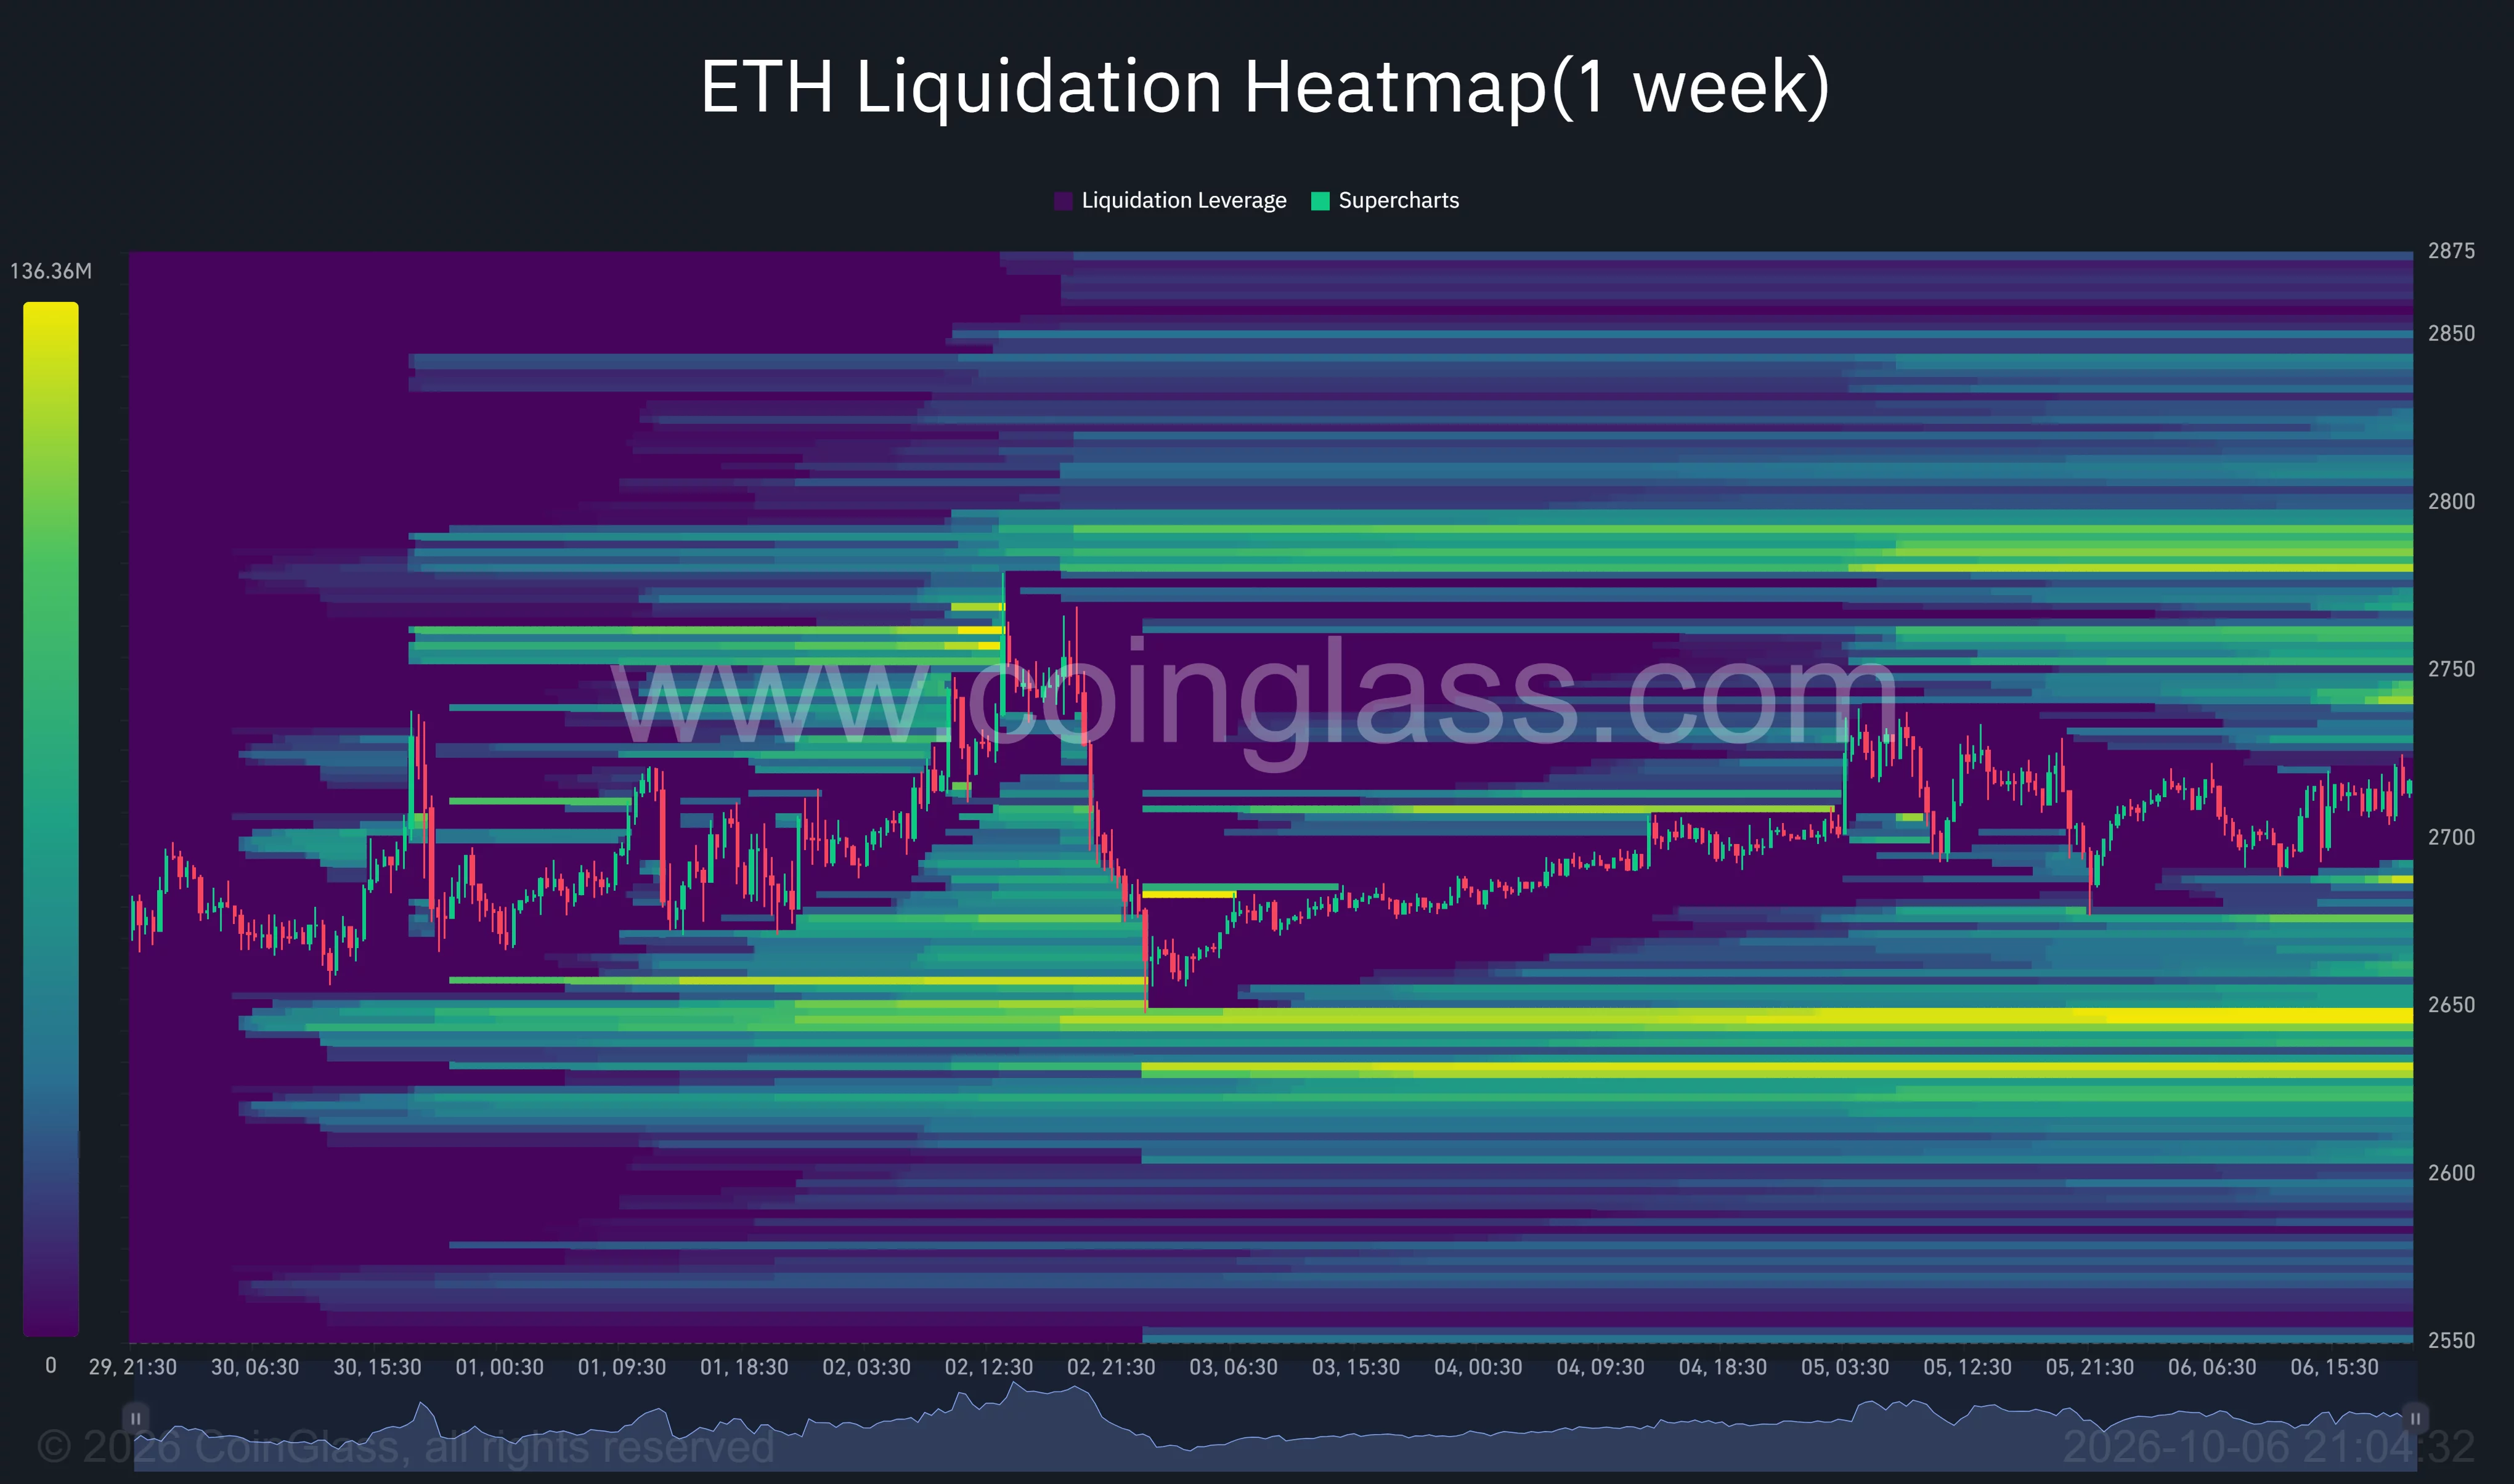
For the upside scenario, the chart levels put $2,738 first, followed by the overhead liquidation bands and daily resistance around $2,800–$2,808. On the downside, $2,679 and $2,660 precede the $2,630–$2,650 liquidity area, with the daily lower Bollinger Band near $2,550 farther below.
Disclosure: This article does not represent investment advice. The content and materials featured on this page are for educational purposes only.