Ethereum price forms ascending triangle below $2,533


Ethereum price held near $2,500 on Aug. 28 as buyers defended the gains from its mid-August breakout, but an overbought daily reading and a dense band of leveraged positions around $2,550 left ETH facing a key resistance test.
- Ethereum price traded near $2,500 after rising about 35% from its mid-August consolidation range.
- A 4-hour ascending triangle placed immediate resistance between $2,533 and $2,550.
- Daily RSI reached 77.4, showing strong momentum but an increased risk of a pullback.
- Liquidation clusters near $2,550 and $2,470 could amplify the next move.
Hotter US inflation limits Ethereum’s breakout
According to data from crypto.news, Ethereum (ETH) price opened at $2,442.49 on Aug. 26 before recovering toward $2,500 over the next two days. ETH traded around $2,500 at the time of writing, leaving it close to the upper end of its three-day range.
The recovery followed an initial reaction to the latest US inflation report. The Bureau of Economic Analysis said headline Personal Consumption Expenditures inflation rose 0.2% monthly and 3.7% annually in July.
The annual figure exceeded the 3.6% increase expected by economists polled by Reuters. Core PCE, which excludes food and energy, matched forecasts at 0.2% monthly and 3.3% annually.
The hotter headline figure lifted the market-implied probability of a September Federal Reserve rate increase to 44% from 36%, Reuters reported. Higher rate expectations can weigh on speculative assets because they raise the relative appeal of interest-bearing investments and tighten financial conditions.
ETH nevertheless avoided a deeper reversal after falling toward $2,430 on Aug. 26. Buyers moved back into the market below $2,500, allowing the token to retain most of the advance that began near $1,870 in mid-August.
The rebound has also followed the US Treasury’s decision to expand its long-dated debt buybacks. The Treasury said it will increase the maximum size of liquidity-support operations for 10-to-30-year securities from $2 billion to at least $4 billion per operation, beginning Sept. 9.
However, the program is designed to support Treasury market liquidity rather than directly inject money into crypto markets. Its influence on ETH therefore depends on how bond yields, the dollar, and broader risk appetite respond.
Ethereum price forms an ascending triangle below $2,533
The 4-hour ETH/USDT chart shows Ethereum forming an ascending triangle after its rapid move from below $1,950. Price has repeatedly tested horizontal resistance near $2,533 while producing a sequence of higher lows.
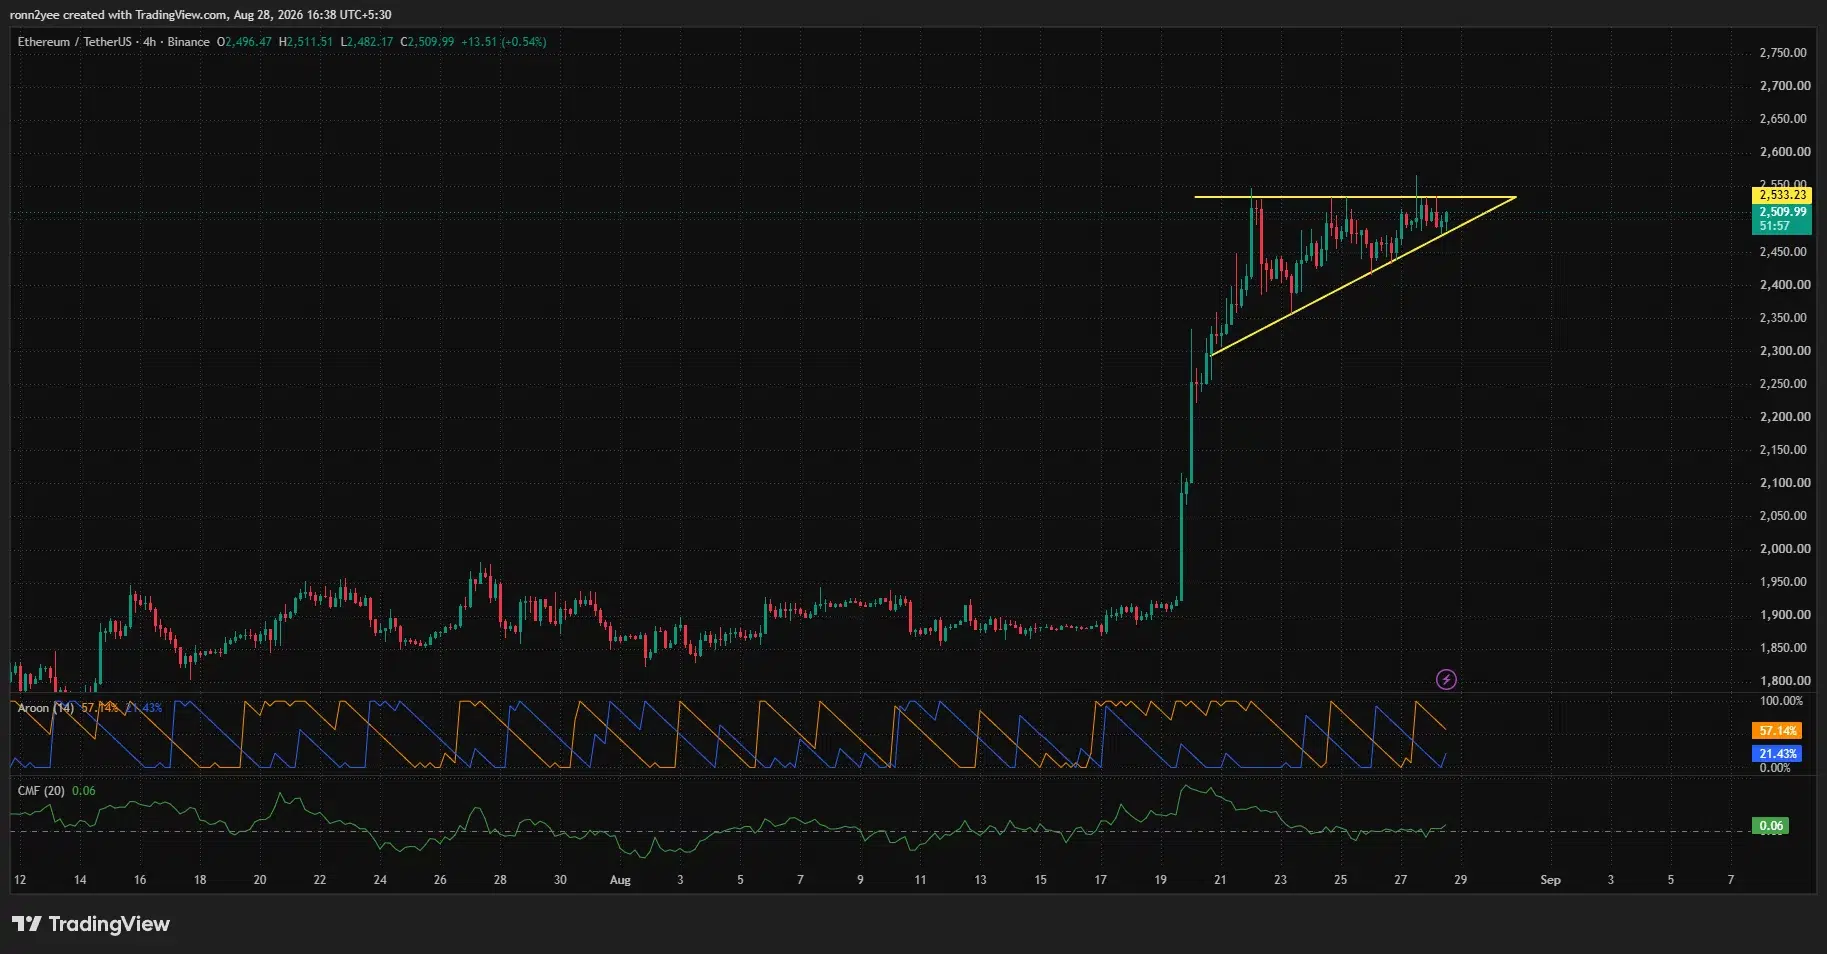
An ascending triangle usually favors buyers when the price closes above its horizontal boundary with increased volume. A confirmed move through $2,533 would also clear the nearby $2,550 resistance area, where ETH has faced several rejections since Aug. 21.
The Aroon Up indicator stood at 57.14%, compared with an Aroon Down reading of 21.43%. The gap suggests that recent highs are more dominant than recent lows, although the Aroon Up reading has declined from earlier levels.
Chaikin Money Flow remained positive at 0.06. The reading points to modest net buying pressure, but it does not show the forceful inflows normally associated with a decisive breakout.
Crypto trader Daan Crypto Trades said in an Aug. 28 X post that ETH had produced a “solid breakout” and established a higher high on the weekly chart. He warned that a return below the former range around $2,300 would weaken the improved market structure.
A 4-hour close above $2,533 would strengthen the triangle setup and place $2,600 in view. Failure to clear the barrier could send ETH back toward the rising trendline, which sits near $2,470 and moves higher over time.
Daily RSI warns Ethereum may be overheated
The daily chart shows ETH trading above the 50% Fibonacci retracement level at $2,453.95. The level is measured from the January high around $3,399 to the June low near $1,509 and now acts as the closest major support.
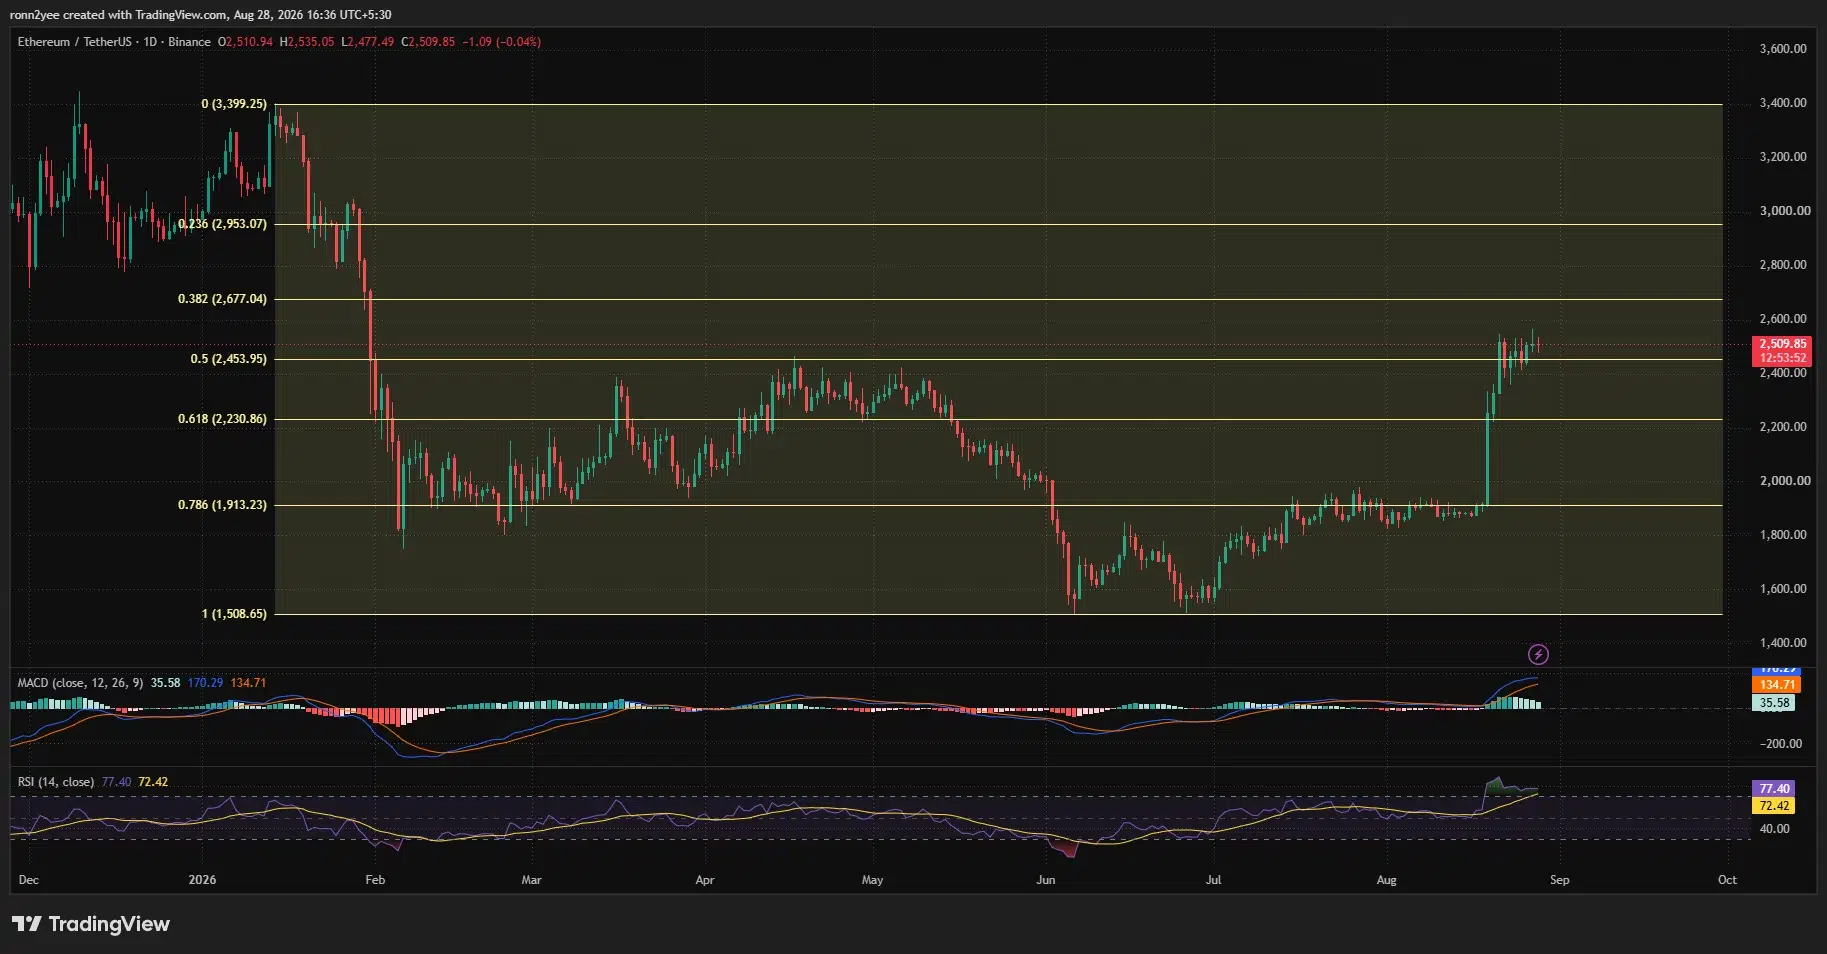
The next Fibonacci barrier sits at $2,677.04. A break above that area could open a path toward the 23.6% retracement at $2,953.07, placing the psychological $3,000 level within reach.
Trader Ted Pillows also identified $2,550 as the immediate resistance zone. In an Aug. 28 post, he said a weekly close above the level could support a move toward $3,000, while repeated rejection could expose the $2,000–$2,100 region.
Momentum indicators remain bullish but stretched. The daily Relative Strength Index stood at 77.4, above the 70 level commonly used to identify overbought conditions. Its RSI moving average was lower at 72.42.
The Moving Average Convergence Divergence indicator remained positive, with the MACD line above its signal line. However, the shrinking positive histogram suggests that upward momentum has started to ease as ETH tests resistance.
An overbought RSI does not guarantee an immediate decline. It instead shows that the advance has moved quickly and leaves the price more vulnerable if buyers fail to produce a breakout.
ETH liquidation map puts $2,550 and $2,470 in focus
The three-day CoinGlass liquidation heatmap shows leveraged positions building on both sides of Ethereum’s price.
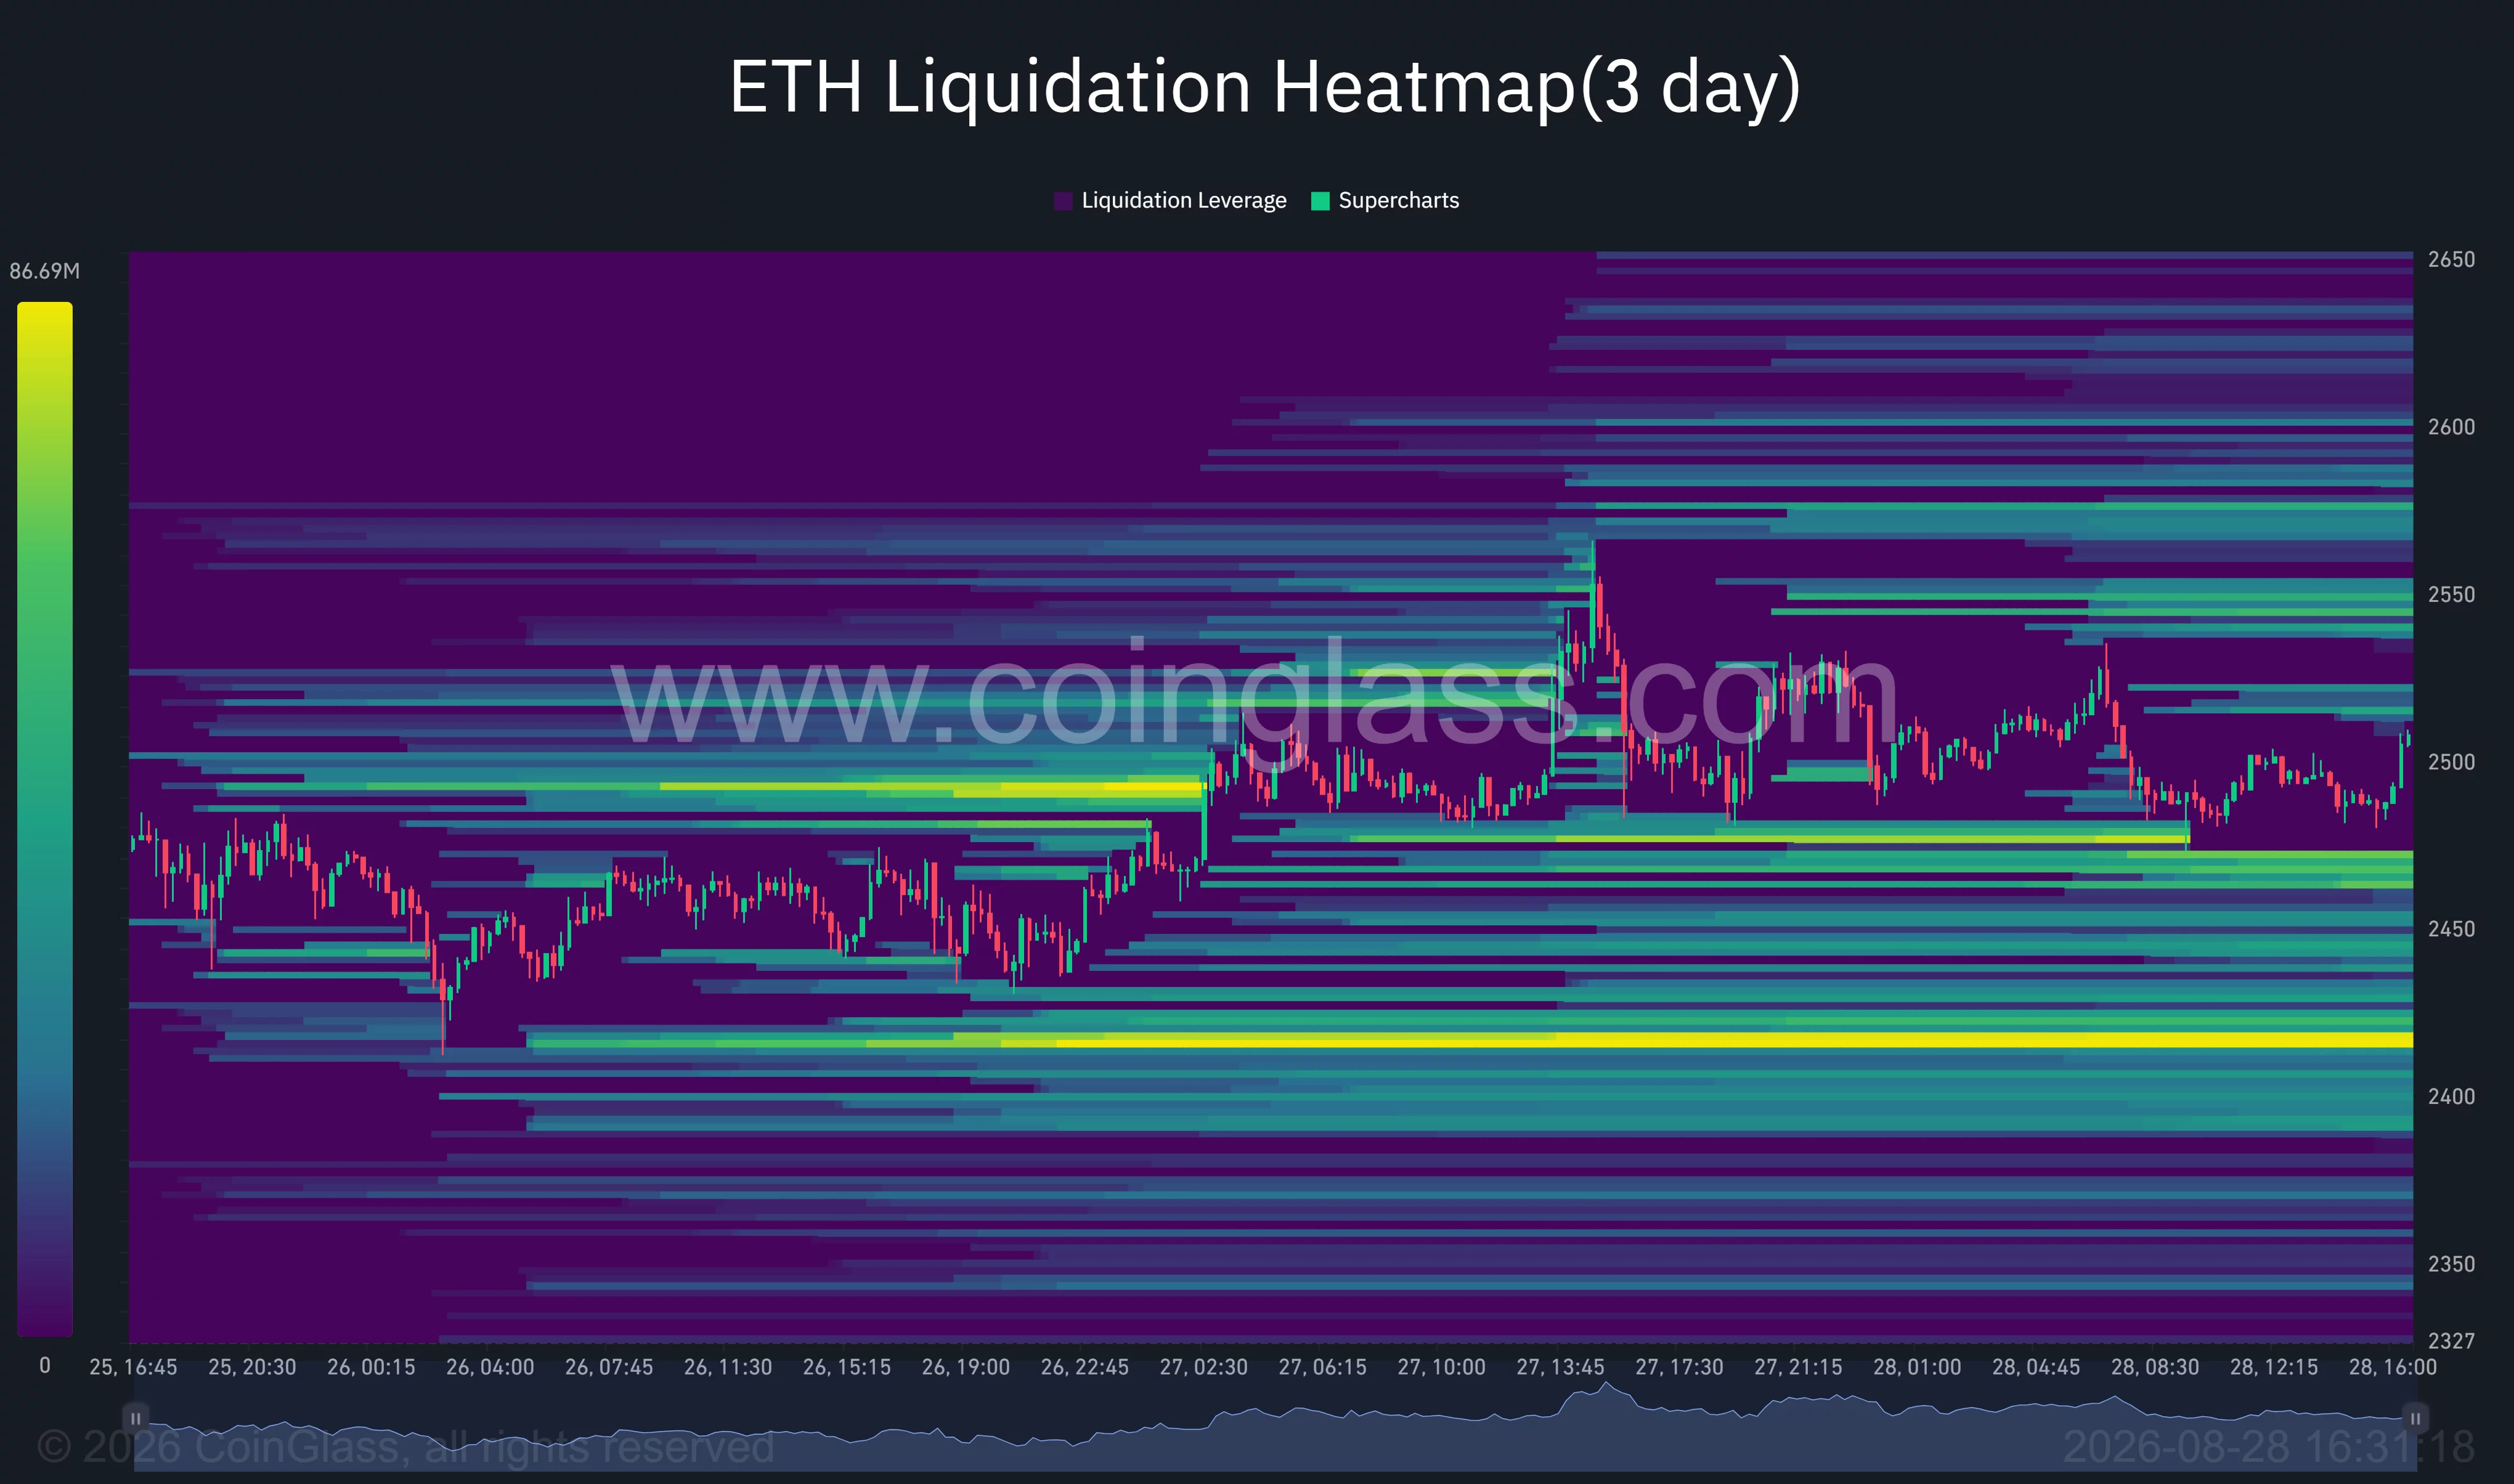
The nearest concentration above ETH lies around $2,540–$2,550, aligning with the horizontal resistance visible on the 4-hour chart. Additional liquidity appears between approximately $2,570 and $2,600.
A move through $2,550 could force short sellers to close positions, adding market buy orders and accelerating a push toward the higher clusters. The technical breakout would still require confirmation because a brief sweep of leveraged positions can reverse quickly.
Below the market, the closest liquidation concentration sits around $2,470–$2,480. A larger and brighter pool appears near $2,410–$2,420, making that region a possible downside target if ETH loses the 50% Fibonacci support at $2,454.
US spot Ethereum exchange-traded funds provide a mixed near-term backdrop. The products recorded about $192 million in net inflows on Aug. 26, but SoSoValue data showed roughly $11.4 million in net outflows during the following session.
Ethereum’s next move, therefore, rests on a narrow technical range. A confirmed close above $2,533–$2,550 would favor an extension toward $2,600 and $2,677, while a loss of $2,454 would expose $2,410 and potentially the former breakout area around $2,300.
Disclosure: This article does not represent investment advice. The content and materials featured on this page are for educational purposes only.