Ethereum price targets $2,550 if key EMA holds


Ethereum price fell below $2,400 on Sept. 2 as renewed fighting between the United States and Iran pushed oil and Treasury yields higher, weakening demand for risk assets.
- Ethereum price dropped to an intraday low of $2,356 after failing to clear resistance near $2,550.
- About $94.2 million in ETH futures positions were liquidated over 24 hours, CoinGlass data showed.
- The daily RSI fell to 59.46, while 4-hour momentum indicators moved deeper into negative territory.
- Support near $2,300 could determine whether ETH stabilizes or extends its decline toward $2,200.
Ethereum price drops below $2,400
According to data from crypto.news, Ethereum (ETH) price traded near $2,372 at the time of writing, down about 1.9% on the day after reaching an intraday low of $2,356. The latest decline extended a pullback from the Aug. 27–28 highs near $2,510.
ETH has now lost about 5.5% from the upper end of that range. Sellers also pushed the token through the $2,400 psychological level, which had limited several declines during the previous two weeks.
The 4-hour chart shows that Ethereum formed a series of lower highs after its final attempt to regain $2,500 on Aug. 31. Selling accelerated on Sept. 2, with the latest 4-hour candle opening near $2,418 before falling as low as $2,356.
The decline has not erased Ethereum’s broader August recovery. ETH remains above the daily 20-day simple moving average at $2,299, as well as its 50-day, 100-day, and 200-day averages at approximately $2,054, $1,903, and $2,030, respectively.
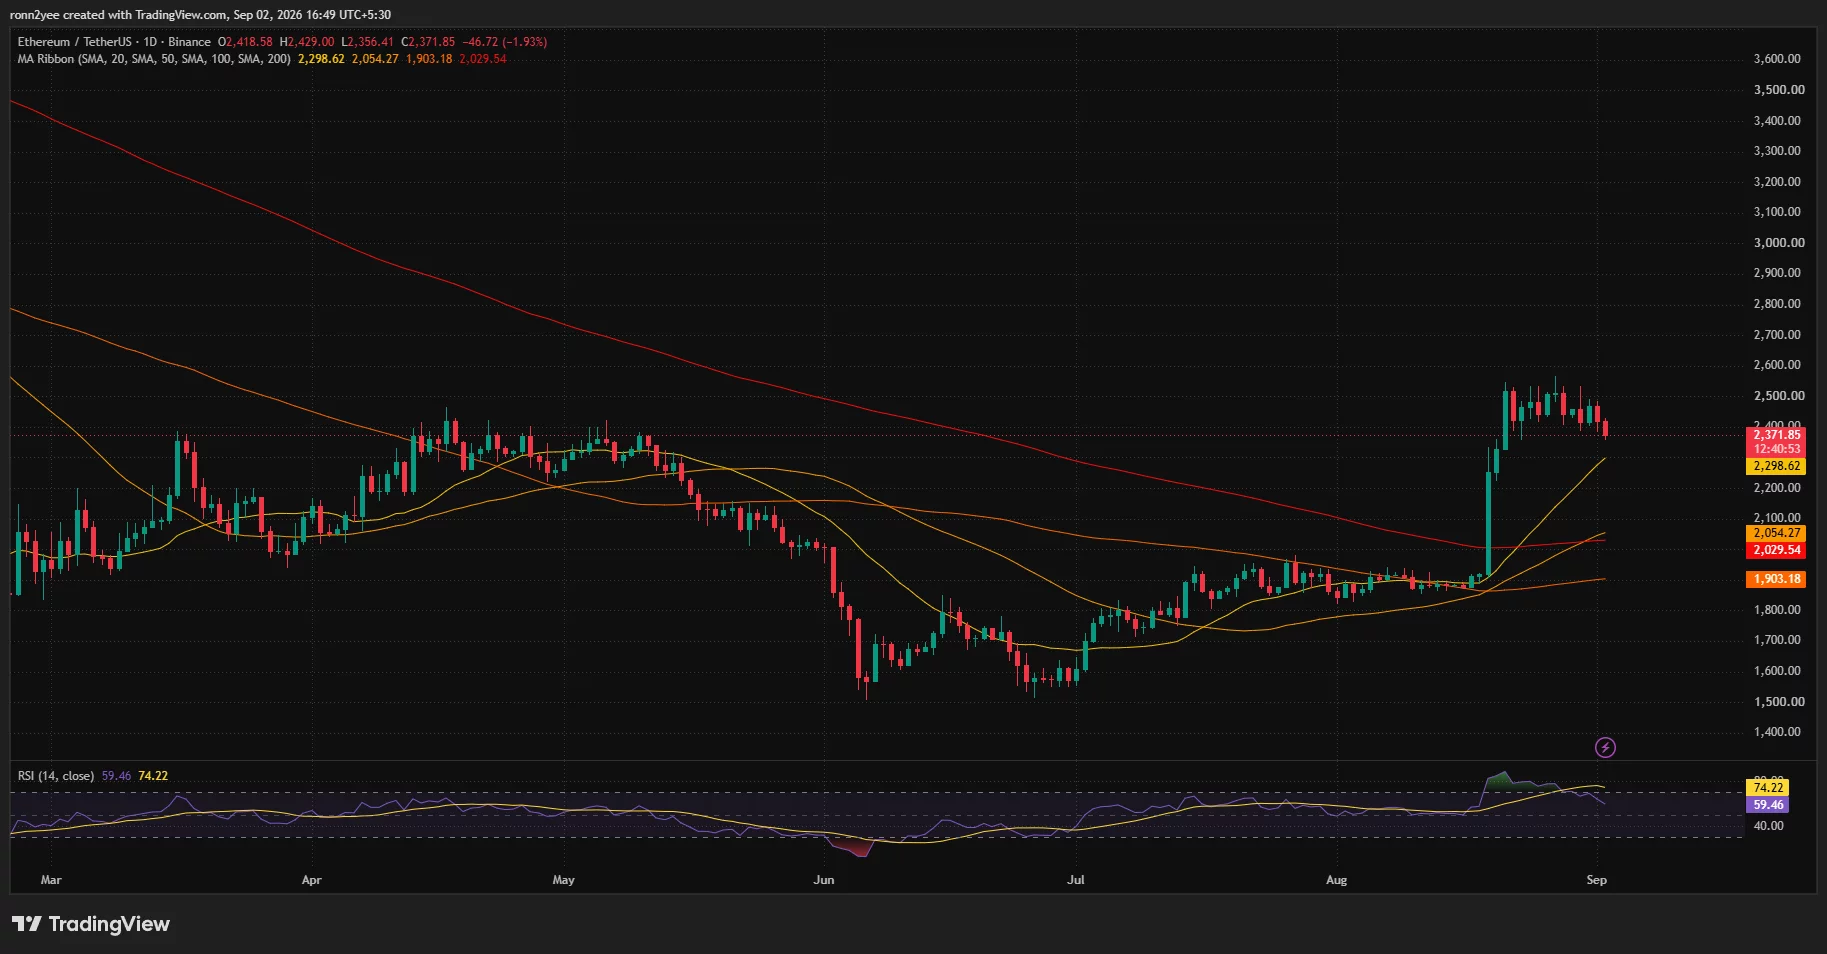
Holding above those averages means the medium-term structure remains stronger than it was before Ethereum’s August breakout, although the short-term trend has weakened.
US-Iran tensions pressure crypto markets
Global markets came under pressure as the United States and Iran exchanged fresh strikes near the Strait of Hormuz. The confrontation pushed Brent crude close to $95 per barrel and raised concerns about another increase in inflation.
Higher oil prices contributed to a broader bond selloff, with the US 10-year Treasury yield climbing above 4.8%, its highest level in nearly three years. Rising yields can reduce demand for assets such as cryptocurrencies because investors can earn higher returns from government debt without taking comparable market risk.
The dollar also strengthened as investors moved toward defensive positions, adding another source of pressure for dollar-denominated assets such as ETH.
US monetary policy added to the uncertainty. The Institute for Supply Management said its manufacturing purchasing managers’ index fell to 54.6 in August from 55.6 in July. Although the figure missed the 55.2 market forecast, a reading above 50 still showed that the manufacturing sector was expanding.
Persistent price pressures and the rise in energy costs have increased expectations that the Federal Reserve could raise interest rates at its Sept. 16 meeting. Reuters reported that markets were assigning a probability of roughly 68% to a rate increase, creating another obstacle for a quick Ethereum recovery.
Liquidations amplify Ethereum’s decline
Derivatives activity increased the speed of the move after ETH fell through short-term support. CoinGlass data showed that approximately $94.2 million in Ethereum futures positions were liquidated over 24 hours.
Ethereum futures open interest stood near $32.48 billion, while futures trading volume reached about $54.43 billion. The figures indicate that leverage remains elevated despite the latest position closures.
The one-week CoinGlass liquidation heatmap shows that ETH moved through several leveraged-long clusters between $2,400 and $2,360. Liquidity remains visible below the current price around $2,350–$2,320, creating a possible area of further volatility if selling continues.
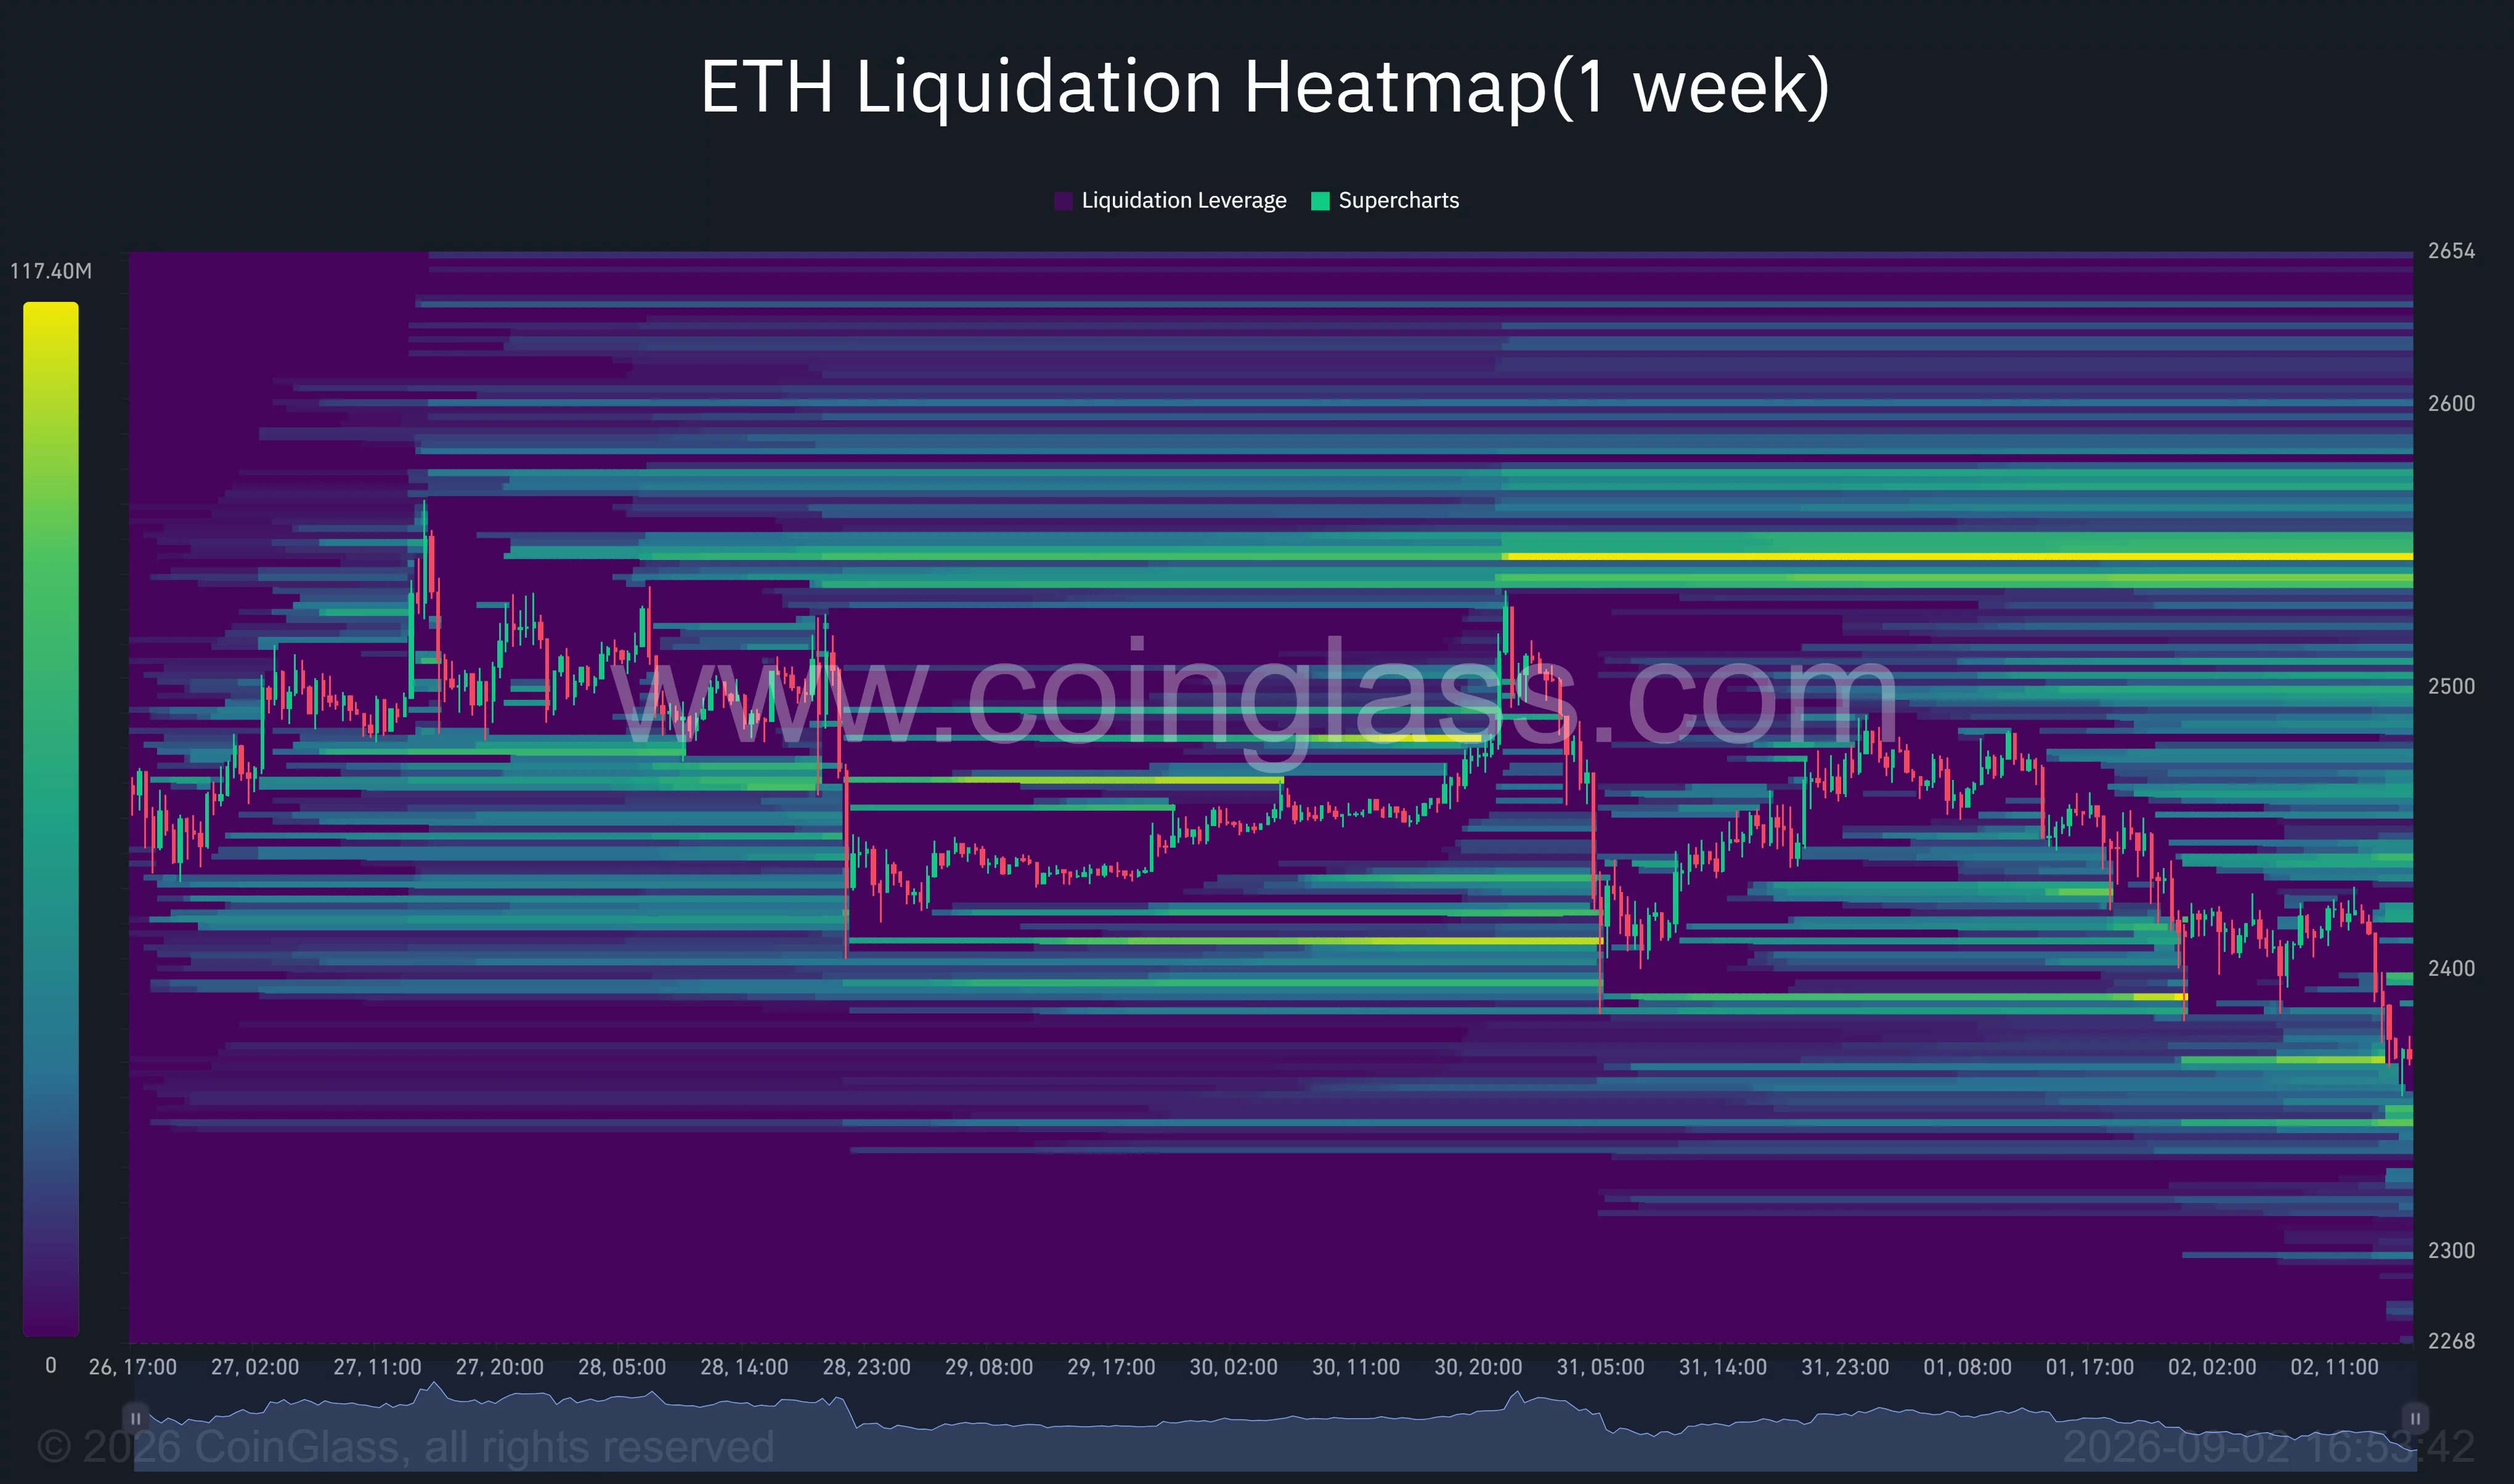
Larger concentrations sit above the market near $2,480–$2,510, while the strongest visible overhead cluster is close to $2,540–$2,560. A recovery toward those zones could force some short positions to close, but ETH would first need to regain $2,400 and reverse the lower-high structure on its 4-hour chart.
Liquidation heatmaps estimate where leveraged positions may face forced closure. They do not guarantee that the price will move toward a specific liquidity cluster.
Ethereum momentum weakens near key support
Ethereum’s daily relative strength index fell to 59.46 after moving above the overbought threshold during the August rally. The reading remains above the neutral 50 level but is trending lower, showing that bullish momentum has cooled.
Shorter-term indicators are less constructive. The 4-hour moving average convergence divergence line stood near minus 13.66, below its signal line near minus 5.58. The MACD histogram was also negative at approximately minus 8.08.
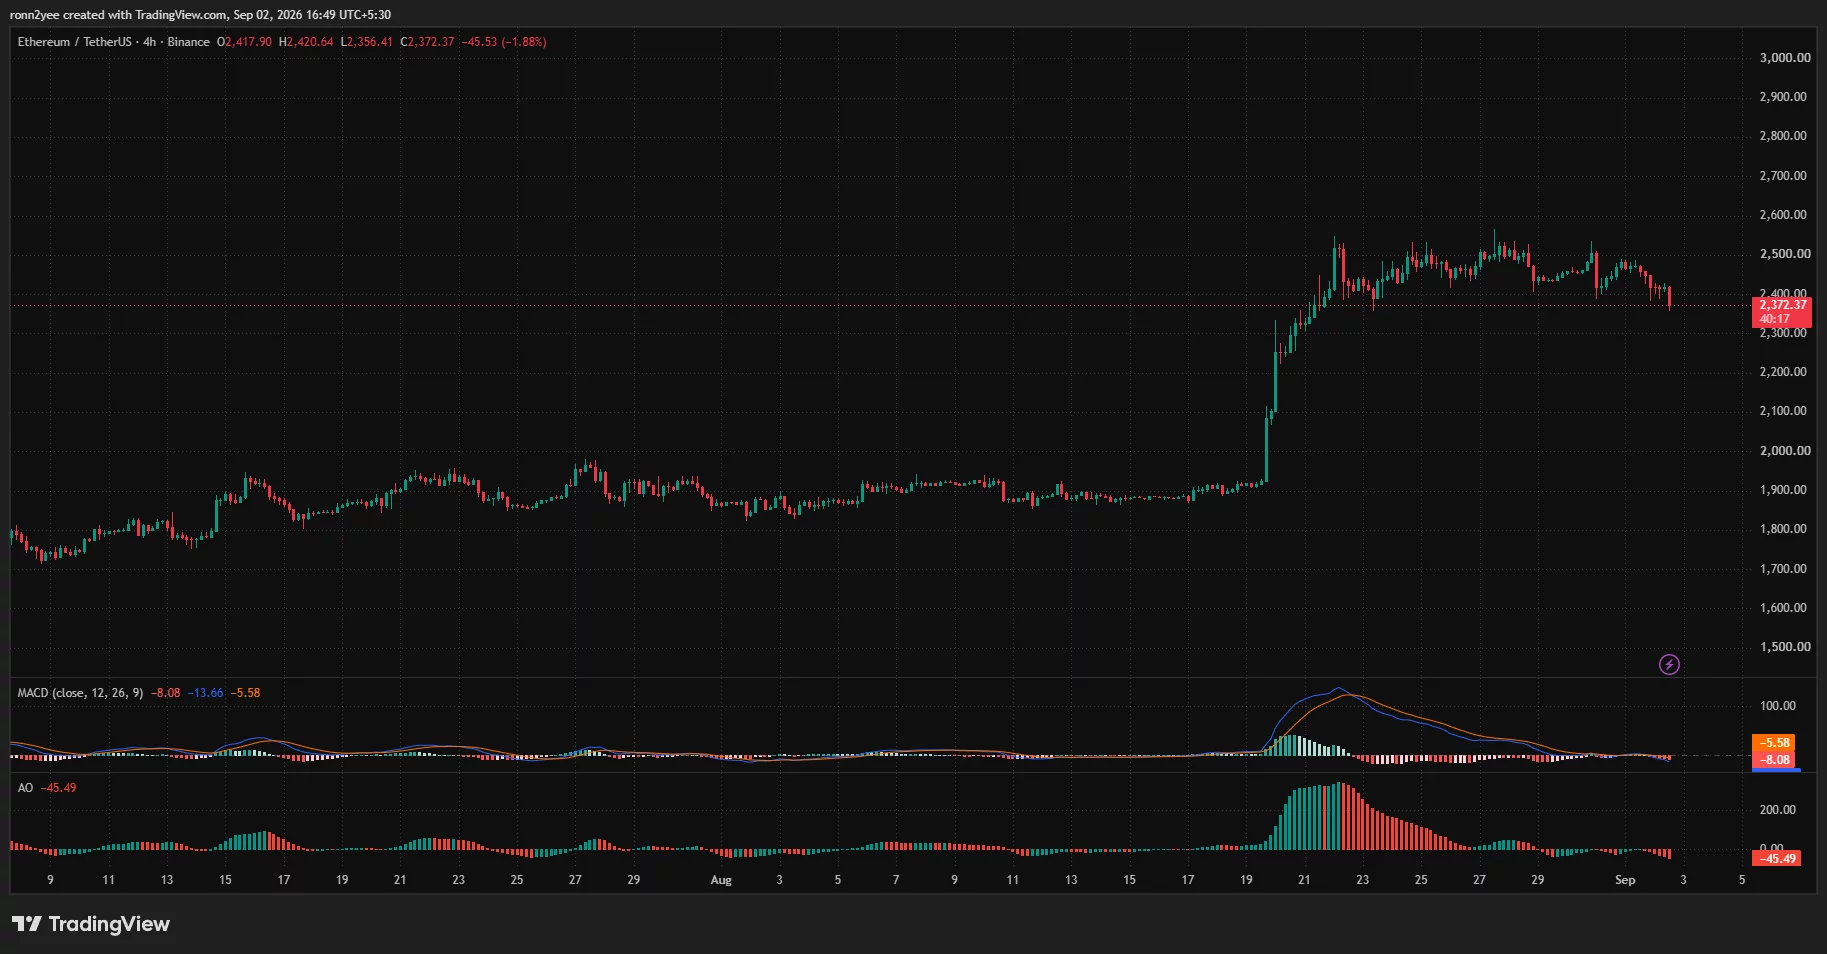
The Awesome Oscillator dropped to minus 45.49, supporting the bearish signal from the 4-hour price structure. Both indicators suggest that sellers retain short-term control, although neither confirms how far the decline will extend.
The first major support range sits between $2,350 and the 20-day average near $2,299. A daily close below that area could expose $2,200, a level also identified by analyst Ted Pillows as the next downside target if ETH fails to hold above its 50-week exponential moving average.
On the upside, ETH must first reclaim $2,400. A break above the $2,500–$2,550 resistance zone would weaken the bearish setup and place the August highs back in focus.
Crypto analyst Crypto XLARGE separately pointed to Ethereum’s performance against Bitcoin, noting that the ETH/BTC monthly candle closed above its 20-month moving average. The analyst said confirmation requires the average to become support, with potential ETH/BTC targets at 0.050 and 0.088 if the breakout holds.
For US investors, oil prices, Treasury yields, and expectations for the September Federal Reserve decision remain the immediate external catalysts. Continued escalation between the US and Iran could keep pressure on Ethereum, while a decline in energy prices or rate-hike expectations may help ETH defend the $2,300 area.
Disclosure: This article does not represent investment advice. The content and materials featured on this page are for educational purposes only.