Bitcoin
Bitcoin (BTC)
$75,805.00 -2.57817
Bitcoin price
Ethereum
Ethereum (ETH)
$2,400.70 -4.3228
Ethereum price
XRP
XRP (XRP)
$1.29 -9.49234
XRP price
BNB
BNB (BNB)
$712.15 -1.29712
BNB price
Solana
Solana (SOL)
$97.13 -4.68765
Solana price
Hyperliquid
Hyperliquid (HYPE)
$77.40 -3.27344
Hyperliquid price
Cardano
Cardano (ADA)
$0.193965 -6.53367
Cardano price
Chainlink
Chainlink (LINK)
$10.85 -6.10361
Chainlink price
POL (ex-MATIC)
POL (ex-MATIC) (POL)
$0.091408 -5.47035
POL (ex-MATIC) price
Gram (prev. Toncoin)
Gram (prev. Toncoin) (GRAM)
$1.31 -2.41612
Gram (prev. Toncoin) price
Bitcoin
Bitcoin (BTC)
$75,805.00 -2.57817
Bitcoin price
Ethereum
Ethereum (ETH)
$2,400.70 -4.3228
Ethereum price
XRP
XRP (XRP)
$1.29 -9.49234
XRP price
BNB
BNB (BNB)
$712.15 -1.29712
BNB price
Solana
Solana (SOL)
$97.13 -4.68765
Solana price
Hyperliquid
Hyperliquid (HYPE)
$77.40 -3.27344
Hyperliquid price
Cardano
Cardano (ADA)
$0.193965 -6.53367
Cardano price
Chainlink
Chainlink (LINK)
$10.85 -6.10361
Chainlink price
POL (ex-MATIC)
POL (ex-MATIC) (POL)
$0.091408 -5.47035
POL (ex-MATIC) price
Gram (prev. Toncoin)
Gram (prev. Toncoin) (GRAM)
$1.31 -2.41612
Gram (prev. Toncoin) price
Bitcoin
Bitcoin (BTC)
$75,805.00 -2.57817
Bitcoin price
Ethereum
Ethereum (ETH)
$2,400.70 -4.3228
Ethereum price
XRP
XRP (XRP)
$1.29 -9.49234
XRP price
BNB
BNB (BNB)
$712.15 -1.29712
BNB price
Solana
Solana (SOL)
$97.13 -4.68765
Solana price
Hyperliquid
Hyperliquid (HYPE)
$77.40 -3.27344
Hyperliquid price
Cardano
Cardano (ADA)
$0.193965 -6.53367
Cardano price
Chainlink
Chainlink (LINK)
$10.85 -6.10361
Chainlink price
POL (ex-MATIC)
POL (ex-MATIC) (POL)
$0.091408 -5.47035
POL (ex-MATIC) price
Gram (prev. Toncoin)
Gram (prev. Toncoin) (GRAM)
$1.31 -2.41612
Gram (prev. Toncoin) price
Bitcoin
Bitcoin (BTC)
$75,805.00 -2.57817
Bitcoin price
Ethereum
Ethereum (ETH)
$2,400.70 -4.3228
Ethereum price
XRP
XRP (XRP)
$1.29 -9.49234
XRP price
BNB
BNB (BNB)
$712.15 -1.29712
BNB price
Solana
Solana (SOL)
$97.13 -4.68765
Solana price
Hyperliquid
Hyperliquid (HYPE)
$77.40 -3.27344
Hyperliquid price
Cardano
Cardano (ADA)
$0.193965 -6.53367
Cardano price
Chainlink
Chainlink (LINK)
$10.85 -6.10361
Chainlink price
POL (ex-MATIC)
POL (ex-MATIC) (POL)
$0.091408 -5.47035
POL (ex-MATIC) price
Gram (prev. Toncoin)
Gram (prev. Toncoin) (GRAM)
$1.31 -2.41612
Gram (prev. Toncoin) price

Reef price rebounds as futures open interest hits 2-year high

Jayson Derrick
Edited by
Markets
News
Reef price rebounds as futures open interest hits 2-year high

Reef token rose for five consecutive days as demand in the spot and futures market rose after it was delisted by Binance.

Reef (REEF) rose to a high of $0.0012 on Sept. 3, marking its highest point in a month and 106% above its lowest point last month. This recovery brings its market cap to over $25 million.

Reef’s recovery followed the launch of a new community developer fund by its developers, aimed at supporting projects related to lending protocols, hardware wallets, DAO infrastructure, and bridge integrations.

https://twitter.com/Reef_Chain/status/1828800920681144562

Reef’s rally led to a sharp increase in investor demand. Data from CoinGecko shows that the 24-hour trading volume jumped to $45 million on Tuesday, up from $23 million on Sept. 1, marking its highest point in nearly a month.

Additionally, Reef’s open interest in the futures market soared to $60 million, its highest level in two years, significantly higher than August’s low of $3 million.

Notably, Reef’s rebound occurred after the token was delisted by Binance, the most popular crypto exchange. Typically, cryptocurrencies tend to retreat after being delisted by tier-1 exchanges.

Data indicates that most of the trading is happening on Gate.io, followed by HTX, KuCoin, and Bitget.

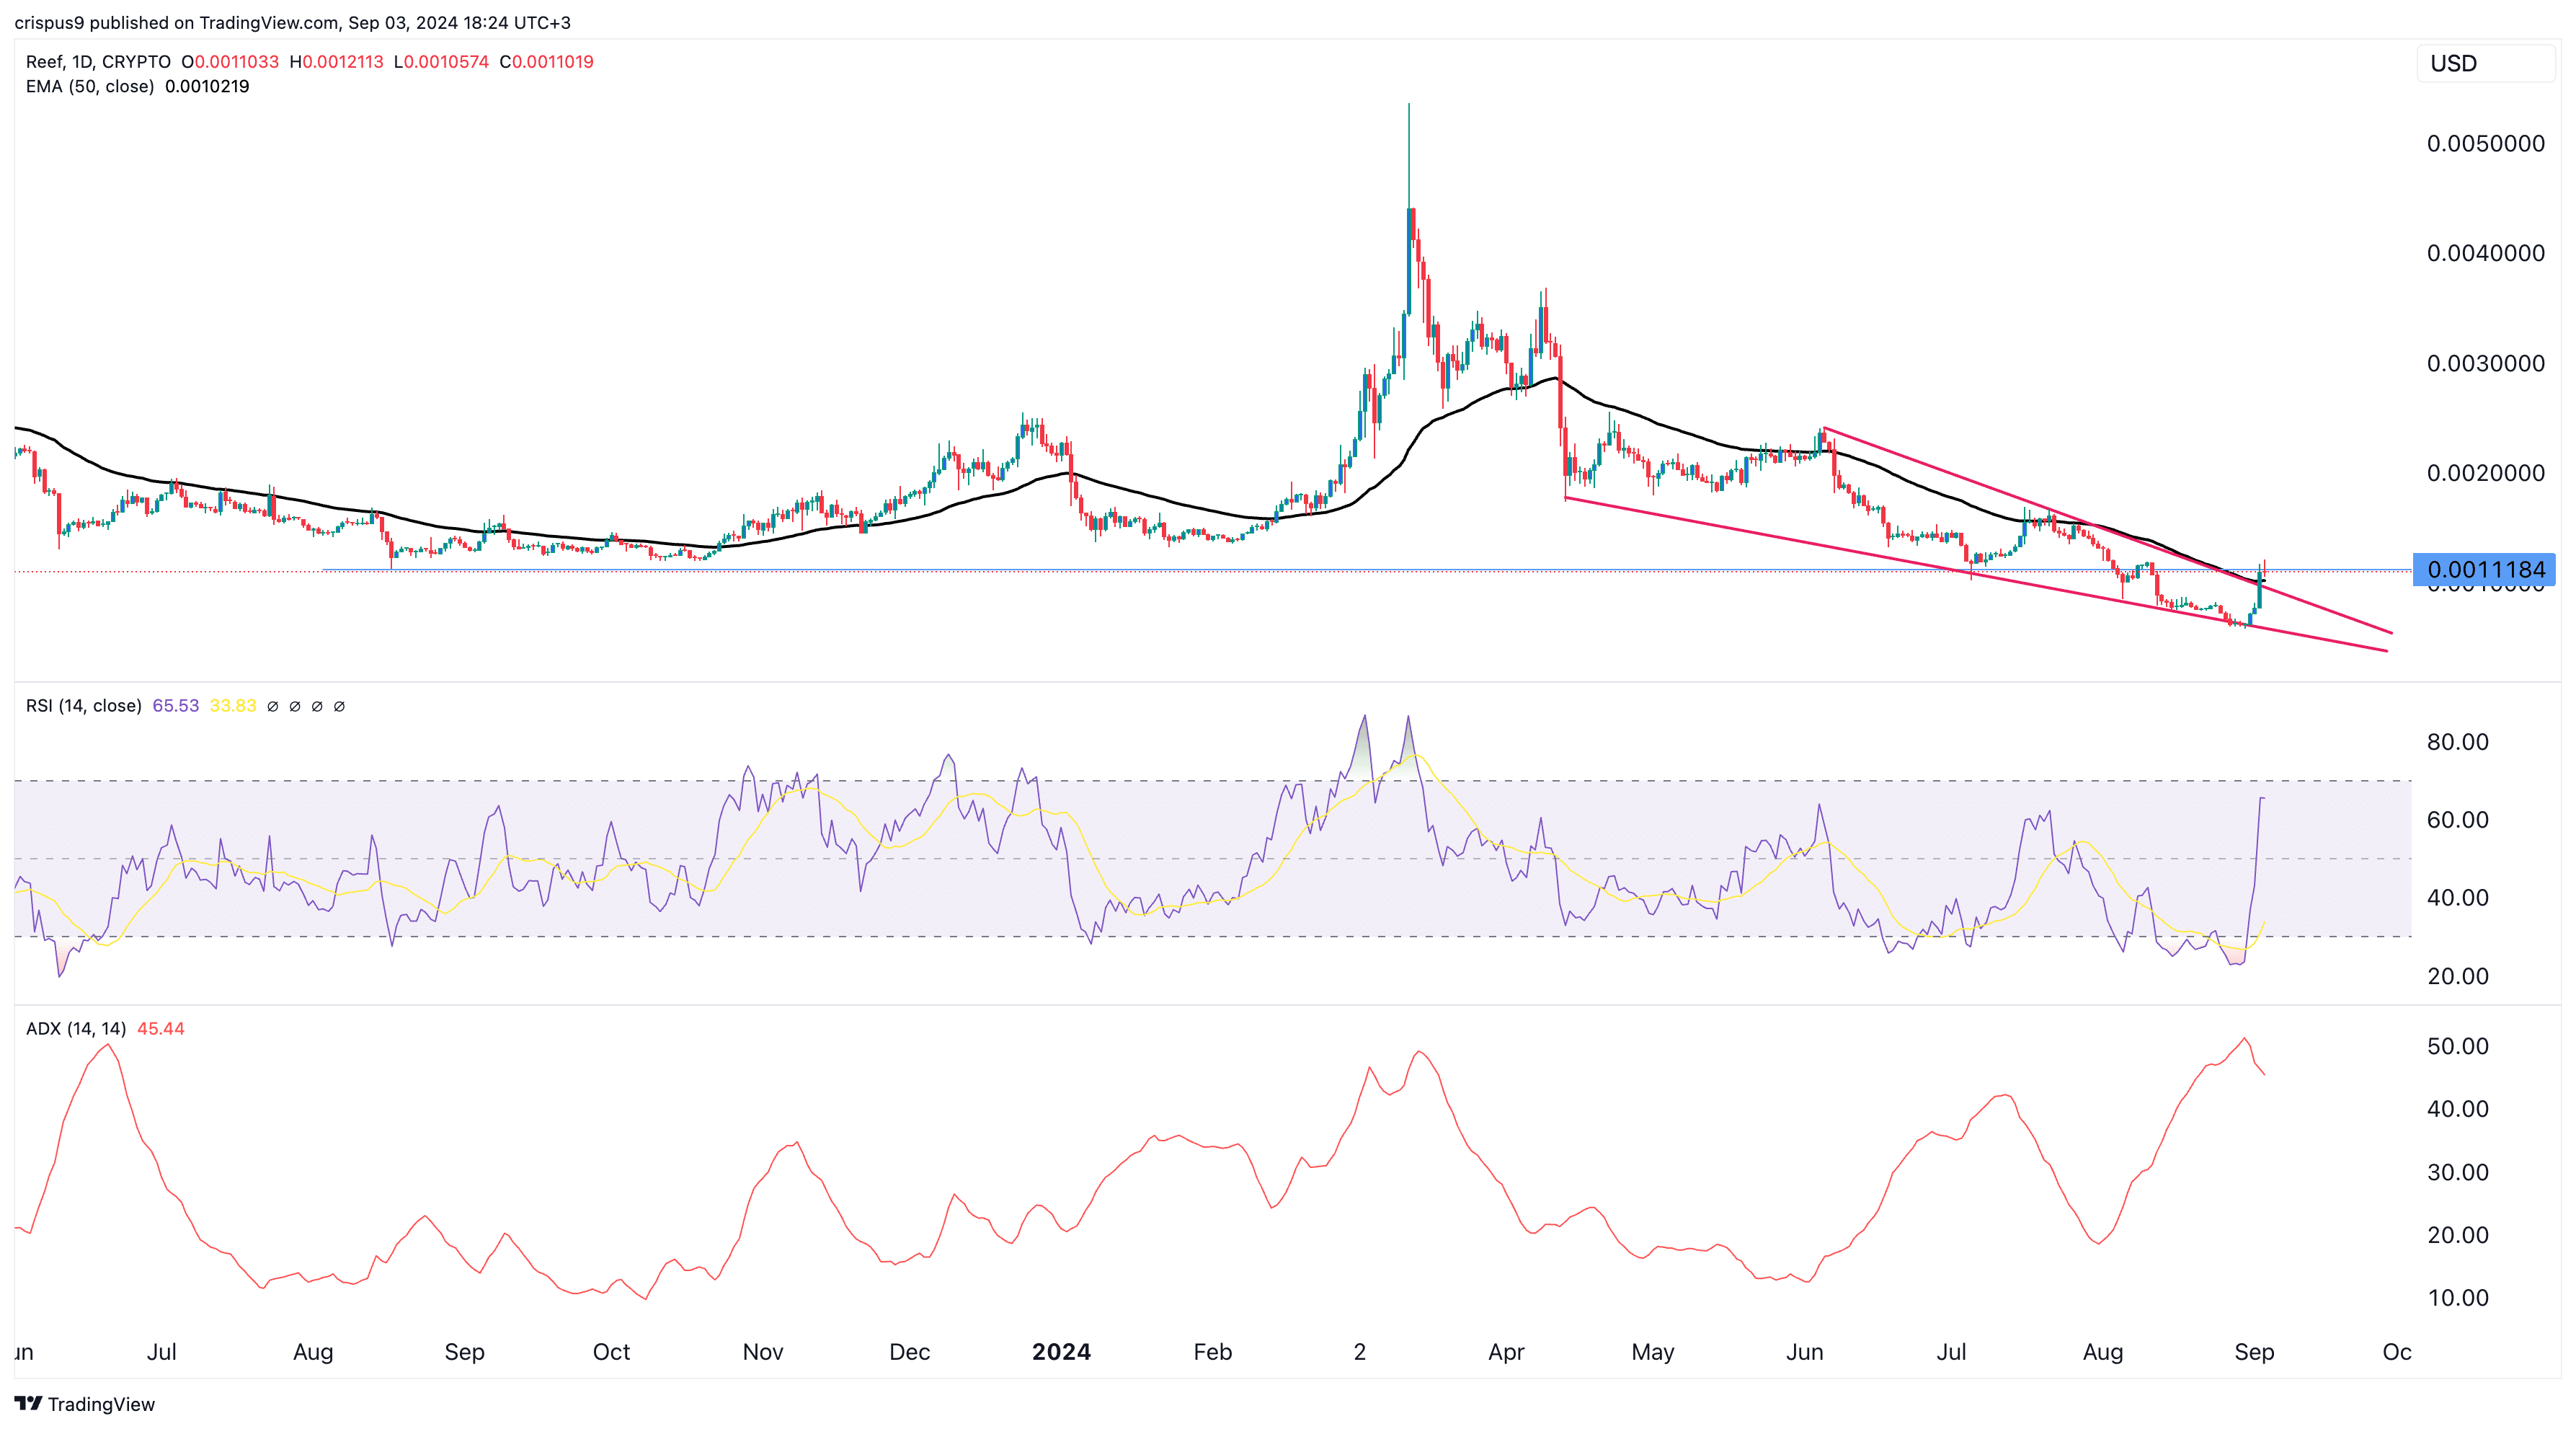
Reef price crosses key resistance

Reef price rebounds as futures open interest hits 2-year high - 2

Reef price chart | Source: TradingView

Reef rose to a high of $0.0013, crossing the important resistance point at $0.0011, its lowest swing in August last year.

Before its rebound, Reef formed a falling wedge pattern, a popular bullish reversal indicator. The token has now rallied above the 50-day moving average, while the Relative Strength Index is nearing the overbought level of 70. The RSI is a momentum indicator that measures an asset’s rate of change.

The Average Directional Index, which measures the strength of a trend, was at 50 and pointing downwards. Therefore, the token will likely retreat briefly as traders take profits before potentially resuming the bullish trend.